Download

1 / 30
300 likes | 435 Vues
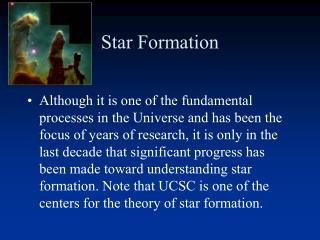
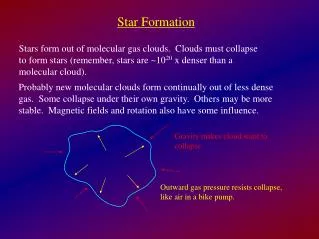
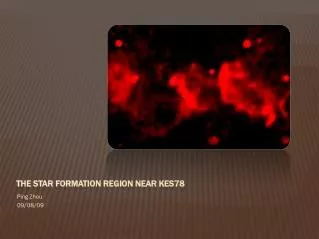
This project investigates star formation across the Gemini region in the Galactic Anti-Centre, focusing on the OB1 molecular clouds. Utilizing a combination of J=1-0 13CO surveys, CO J=3-2 mapping, and complementary data from UKIRT, Spitzer, and Herschel, the objective is to map star formation on global scales, trace jets and outflows, and identify protostellar cores. This comprehensive study aims to enhance our understanding of star formation efficiency and the lifecycle of stellar objects, contributing valuable insights to the field of astrophysics.

E N D
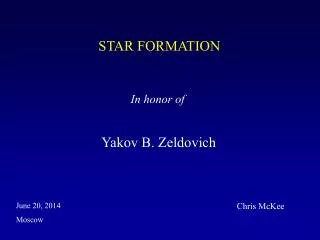
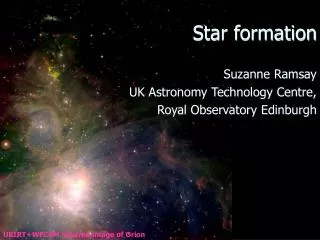
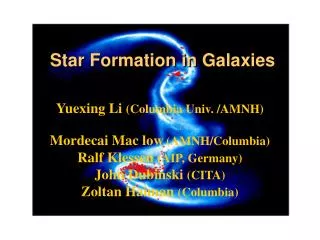
Joint DDT ProgramStar Formation in the Gem OB1 Region Chris Davis, Jan Wouterloot, Watson Varricatt, Ant Chrysostomou and the JCMT/UKIRT Science staff
Molecular Clouds in Gemini Second/Third Galactic Quadrant: l ~ 190 degs (Galactic Anti-Centre) 13CO J = 1-0 survey (170 < l < 196 degs) by Kawamura et al. (1998) with a 3’ beam. CO J = 1-0 mapping with FCRAO with an angular resolution of about 50” (Carpenter et al. 1995) 13CO contours (Kawamura et al. 1998) Crosses mark locations of early type stars - the OB associations - catalogued by Humphreys (1978)
Molecular Clouds in Gemini Clouds associated with the Orion Spur or Perseus Arm? Star formation at ~ 300pc and ~ 2 kpc Studying clouds with large galacto-centric distances… 13CO contours (Kawamura et al. 1998) Crosses mark locations of early type stars - the OB associations - catalogued by Humphreys (1978)
Existing Complementary Data: Near-IR: UKIDSS GPS JHK data available (WFCAM) Mid-IR: Some Spitzer data are available in PI projects (but also GLIMPSE360 - 3.6um and 4.5um) Far-IR: Herschel data will eventually be available (Hi-GAL360, 5-band PACS and SPIRE) Sub-mm: not covered by Gould Belt Survey, but is part of JPS (SCUBA-2) MSX A MSX A
How can we complement these existing/proposed observations? Joint UKIRT/JCMT Project CO 3-2 mapping with Harp/JCMT H2 (and K band) imaging with WFCAM/UKIRT can
Infrared “Finders” Firstly we imaged the clouds along the plane with WFCAM… Each square represents a “WFCAM Tile” (covering 0.8 sqr degrees) WFCAM - 0.4” pixels K >18th mag point sources detectable in a few minutes (broad band) or ~10 mins narrow band)
Scientific Goals of the Project 1. Map star formation on global scales, across a number of independent regions and GMCs in the outer galaxy 2. Trace jets and outflows in the near-IR (H2) and the Sub-mm (CO 3-2) 3. Identify (Spitzer) protostars from their association with outflows 4. Identify proto-stellar cores from their association with outflows 5. With combined UKIRT/Spitzer/JCMT/Herschel data, build up a census of prestellar cores, protostellar cores, and T Tauri stars (no molecular flow) 6. Establish prestellar/protostellar ratio, lifetimes, etc… - Star formation efficiency - Star formation rate
Tile A 1’
Tile B 1’
Tile B 1’
Tile E 1’
JCMT ObsLarger, shallow maps:CO 3-2 - 1000 MHz bandwidth - 488 kHz/0.4 km/s resoln - 0.1 sec sample time - 3/4 array step - basket weaveSmall, deep maps:CO 3-2 and H13CN 4-3 - 250 MHz bandwidth - 61 kHz/0.05 km/s resoln - 1 sec sample time - 1/4 array step - basket weave (some map pairs repeated with 15” offset). Small maps Tile A: A-CenA 06:08:43.0 +21:31:06 6’ x 6' A-Na 06:08:52.0 +21:38:09 7’ x 6' A-Nb 06:08:32.0 +21:40:51 3’ x 3' (weak) A-S 06:09:26.0 +21:23:30 5’ x 3' (weak) A-NE 06:09:52.0 +21:38:26 4’ x 3' (weak) Tile B: B 06:08:58.0 +20:39:10 21’ x 9' B-S 06:09:53.0 +20:32:50 9’ x 9' B-W 06:07:47.0 +20:39:36 3’ x 3' (weak) B-ano 06:09:08.0 +20:28:00 5’ x 5' (weak) Tile D: D-NE 06:14:54.0 +19:01:40 9'x5' Tile E: E-Cen 06:14:24.0 +17:44:30 12’ x 7' E-W 06:13:57.0 +17:50:28 4’ x 3' (weak) E-NW 06:13:45.0 +17:55:20 3’ x 3' (weak) Tile F: F-Cen 06:12:58.0 +17:57:44 20’ x 11'
Tile B - Fast Map CO 3-2 integrated Map size: ~ 55 x 55 arcmin
TILE A AFGL 5180 AFGL 6366 CO 3-2 integrated intensity
AFGL 5180 TILE B Sh 2-252 A AFGL 5183 AFGL 6366 CO 3-2 integrated intensity
AFGL 5180 Sh 2-255B TILE F Sh 2-255 AFGL 6366 TILE E CO 3-2 integrated intensity
CO 3-2 data quality… Large, shallow maps - 0.4 km/s resolution : 0.6-1.2 K in most regions (as high as 1.8 K in some parts of Tile A, and up to 3.0 K in parts of Tile E) Small, deeper maps - 0.05 km/s resolution: 0.6-0.9 K in almost all regions (more even depth) We are currently focusing on Tile E
Tile E H2-K image Outflows Identified independently by manually scanning through PV diagrams (binned to 0.55 km/s resolution)
Tile E Outflow #19
Tile E H2-K image Bipolar Outflow #3 and 5
Not all CO flows are seen in H2 emission ! Tile E Outflow #11 H2-K image
Antonio’s Outflow Extraction Algorythm! Calculates moments V and sigma from average spectra (excluding brightest spectra) and integrates between 2 and 15 sigma either side of this average V. Remo also has a script! Color-composite of red-shifted, ambient (green) and blue-shifted CO HV Red- and Blue-shifted contours on “ambient velocity” CO image
Antonio’s Outflow Extraction Algorythm! H2-K Image HV CO contours
H2-K Image SCUBA contours SCUBA 850 micron contours (Di Francesco et al. - SCUBA archive paper) Plenty of dust emission … “protostellar” cores clearly related to outflows
Final Remarks 1. We have identified a very interesting region. 2. Complementary data are available in abundance. 3. The DDT project doesn’t “tread on the toes” of exisiting surveys. 4. Possibility for a number of “stand alone” papers (examining individual regions) and/or an “overview” paper comparing these seemingly similar sites of clustered star formation. 5. JCMT and UKIRT scientists are now collaborating (best chums) ! 6. …
Tile B Thank You Spitzer - IRAC 3.6/4.5/5.8 micron