Theoretical methods for predicting gene function I. Overview
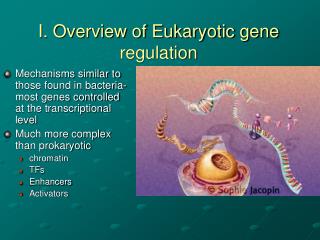
This document provides an in-depth overview of theoretical methods for predicting gene function, inspired by the work of Bork et al. (1998). It explores the concept of biological function, describing it as the capabilities of gene products, and examines various types of functions—phenotypic, molecular, and cellular. The text outlines significant cellular processes, biochemical pathways, and the interplay of physiological subsystems. It highlights the importance of protein interactions, classification methods such as Gene Ontology (GO), and discusses the complexities of function prediction based on genomic and protomic data.

Theoretical methods for predicting gene function I. Overview
E N D
Presentation Transcript
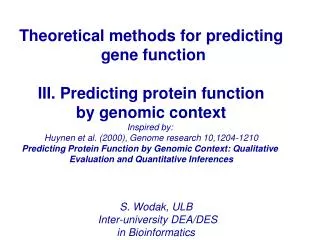
Theoretical methods for predicting gene function I. Overview Inspired by : P. Bork et al. J. Mol. Biol. (1998),283,707-725 Predicting Function: From Genes to Genomes & Back S. Wodak, ULB Inter-university DEA/DES in Bioinformatics
BIOLOGICAL FUNCTION What is biological function? “a capability that a physical gene product (or gene product group) carries as a potential” [Rison, Thronton & Hudgman, 2000] “Action characteristic d’un élément, d’un organe, dans un ensemble, souvent oppose à structure” [Robert, 1982]
Phenotype morphology, physiology, behaviour... The different levels of biological function phenotype dysfunction Phenotype 1 Phenotype 2 Phenotype 3 Cellular function metabolic pathway, signalling cascade.. cellular localisation, co-expression.. process 1 process 2 Process 3 Molecular function binding site,specificity, catalytic activity, -chemistry: aa sequence, posttranslational modifications; -3D structure
Molecular function Specific binding sites for substrates, small molecule effectors, nucleic acids, other proteins; kinetic properties Determined by the set of chemical (amino acid sequence) structural and dynamic properties (conformational States) 3D structure: an important attribute of function; necessary for understanding function Post translational modifications (glycosylation, propeptide cleavage, protein splicing) may influence/determine molecular function
Cellular function The role played by a protein in the context of a cellular process (metabolic pathway, regulatory pathway, signal transduction cascade) in groups of proteins Determined by functional and physical interactions between proteins and other molecules For proper functioning, the protein must be translocated to the appropriate intra- or extra cellular compartment -> localisation Regulation of protein activity, (f.e. via regulation of gene expression, in specific tissues, cells, or in time), are important attributes of cellular function..
The physical and Functional Interactions In the Cell Living cell Genome t.f Protein 2 t.s. Protein 1 Biochemical pathway Physical interactions Functional interactions
Phenotype Determined by the interplay between the different physiological subsystems, and between those and the environment Subject to compensating effects of different intra- and inter-cellular processes Rarely tracable to single genes..
EcoCyc gene product classification 3 levels deep 1.1 6 categories at highest level 1.3.1 1.2 1. Macromolecular metabolism 1.3.2 1.3 2. Elements of external origins 1.3.3 1.4 ... 3. Miscellaneous. 4. Small molecule metabolism 5. Structural elements 6. Cellular processes following Rison et al., (2000)
TIGR gene product classification 16 categories at highest level 2 levels deep 1. Amino acid biosynthesis 1.1 2. Autotrophic metabolism 1.2 3. Biosynthesis of co-factors 1.3 4. Cell envelope …. 5. Cellular processes …. 6. Central Interm. metabolism 7.…………... 1.13 .………………….. following Rison et al., (2000) 16. Other categories
GO: Gene Ontology 3 categories at highest level 9 levels deep 1. Protein 2. Ribozyme 1.9.3.21.6 Insulin receptor ligand 3. Nucleic acid
The Gene Ontology (GO) consortium The three categories of GO: Biological process Molecular function Cellular component Nucleic acid binding Enzyme DNA binding Helicase Adenosine triphosphatase Chromatin binding DNA helicase ATP-dependent helicase DNA-dependent adenosine triphosphatase MCM2 Mcm2 Mcmd2 MCM3 Mcm3 Mcmd CDC54/McM4 CDC46/MCM5 Mcm5 ATP-dependent DNA helicase Lamin/chromatin binding MCM2 McM3 CDC54/McM4 Mcm4 CDC46/MCM5
Functions can switch with substrate concentrations one gene-one protein-one function is too simple! one protein -> several functions Jeffrey C. Moonlighting proteins (1999) TIBS 24, 8-11 PutA (E.coli): a proline dehydrogenase in plasma membrane Transcriptional repressor/binds DNA in cytoplasm Phosphoglucose isomerase: 2nd step in glycolysis in cytosol different roles (cytokine, etc..) when secreted G3PDH: glycolytic enzyme as a tetramer, nuclear uracil-DNA glycosylase as a monomer CFTR: cAMP-dependent chloride channel and a regulator of an epithelial sodium channel (ENaC)...
The different steps of function prediction Bork et al. (1998) J.Mol. Biol. 283, 707-725 Information from genome comparisons Information on orthologs Information on homologs Assembled genomic data [0] Analyse nucleotide frequencies/codon usage, identify repeats, non-coding signal,promoters translational start/stop [1] Predict ORF’s /genes [2] Domain analysis [3]
The different steps of function prediction Bork et al. (1998) J.Mol. Biol. 283, 707-725 Information from genome comparisons Information on orthologs Information on homologs Differential genomic analysis: -absence of genes -compare gene order -compare pathways Domain analysis [3] [4] Use information on genome context Gene order; co-regulation Pathway/process reconstruction
The different steps of function prediction Bork et al. (1998) J.Mol. Biol. 283, 707-725 Information from genome comparisons Differential genomic analysis: -absence of genes -compare gene order -compare pathways .. …. … …. [4] Use information on genome context Put into context of cellular processes [5] Phenotype
Information on function Public databases, such as: GenBank, EMBL, SWISS-PROT,PDB, contain information on individual genes and proteins; Information on function appears as annotation in text form, and cannot be readily analysed by a computer.
Till now: analysis of individual genes & proteins a b c d e Genes A B C D E Proteins Comparative analyses Pfam... SCOP CATH Sequence systematics 3D structure Systematics
Gene Tsoka & Ouzounis, (2000) Fusion event Frequency of enzymes Participating in fusion event: 106/267 = 40% Frequency of non-enzyme participating in fusion event : 161/267 = 60% The fraction of non-enzymes participating in fusion events is larger than of enzymes! Overall: 267 genes participate in fusion events 106 enzymes participating in 96 fusion events 636 enzymes 161 non enzymes participating in fusion events 161=4.4% . 3654 16.7% 4.4% 3654 non-enzymes 413 in complexes = 65% A gene participating in a fusion event has a higher prob. (20%) of being a non enzyme than an enzyme Of the 636 enz 223 mono = 35% Of the 106 enz in fusion events 81 ‘in complexes’ ~76% 30 mono ~ 28%