Download
1 / 61
620 likes | 776 Vues
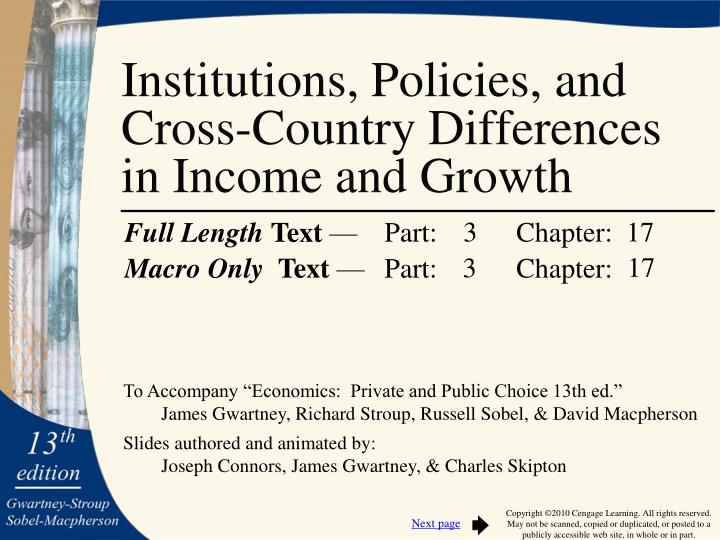
Institutions, Policies, and Cross-Country Differences in Income and Growth. 3. 17. 17. 3. How Large are Income Differences Across Countries?. Measuring Cross-Country Differences in Income.

E N D
Institutions, Policies, and Cross-Country Differences in Income and Growth 3 17 17 3
How Large are Income Differences Across Countries?
Measuring Cross-Country Differences in Income • Countries use different currencies. Thus, the purchasing power of different currencies must be converted to a common denominator in order to compare incomes in different countries. • This could be done with exchange rates. • But, exchange rates are influenced by capital movements and will fail to reflect the prices of goods not traded in international markets. • They may be an inaccurate indicator of the purchasing power of different currencies. • Economists favor the purchasing power parity (PPP) method of income comparisons.
Measuring Cross-Country Differences in Income • Economists favor the purchasing power parity (PPP) method of income comparisons. • This method uses the cost of purchasing a common bundle of goods consumed in each country and uses this cost to estimate the purchasing power of each currency. • The purchasing power of each currency is then used to convert the income levels of each country to a common currency, typically the U.S. dollar.
Cross-Country Differences in Income • The following slide highlights the 2007 per person income for various high, middle and low-income countries. • The incomes in Norway, the US, and Hong Kong are the highest in the world, in excess of $39,000. • The per-person income in high-income countries is about 50 times the figure for the countries with the lowest incomes. • The incomes of less-developed countries will be understated because GDP figures generally omit household production. • Even after making some allowance for this, it is clear that the income differences between the high and low-income countries are huge.
Cross-Country Differences in Income The 2007 Per Person Income Levels for high-, Middle-, and Low-Income Countries measured in 2005 PPP U.S. dollars High-Income Countries Middle-Income Countries Low-Income Countries Norway $49,359 South Korea $23,399 Ukraine $6,529 United States 43,055 Hungary 17,894 China 5,084 Hong Kong 39,953 Poland 15,634 Bolivia 3,972 Switzerland 37,581 Russian Federation 13,873 Honduras 3,585 The Netherlands 36,956 Mexico 13,307 Indonesia 3,506 Canada 36,260 Chile 13,108 Philippines 3,217 Ireland 36,118 Malaysia 12,766 India 2,600 United Kingdom 33,717 Argentina 12,502 Nigeria 1,859 Germany 33,181 Turkey 11,825 Bangladesh 1,172 Japan 31,689 South Africa 9,125 Malawi 719 France 31,625 Brazil 9,034 Sierra Leone 641 Italy 28,682 Thailand 7,682 Niger 592
How Do Growth Rates Vary Across Countries?
Cross-Country Differences in Growth • The following slide shows the growth of per person GDP during 1990-2007 for the countries with the best and worst growth records, along with the figures for high-income countries. • Except for Ireland, the ten fastest growing economies were LDCs at the beginning of the 1980s. The two most populace countries, China and India, are on the high-growth list. • The high-growth economies grew at an annual rate of 4.1% or more (twice that of most high-income countries). This has closed the gap relative to their richer counterparts since 1990. • While LDCs dominate the high-growth list, the countries with the worst growth records were also LDCs. The countries on the right side of the table are not only poor, they are falling further and further behind.
Economic Growth: 1990-2007 The Growth of Per-Person GDP for High-Growth, High-Income Industrial, and Low-Growth Countries (1990–2007) High-Growth High-Income Industrial Low-Growth China 9.4% Norway 2.6% Central African Rep. -1.0% Vietnam 6.1% United Kingdom 2.1% Georgia -1.2% Ireland 5.1% The Netherlands 2.1% Ukraine -1.2% South Korea 4.8% Australia 2.0% Serbia -1.5% Taiwan 4.7% United States 2.0% Kyrgyz Republic -1.6% Trinidad and Tobago 4.7% Canada 1.8% Guinea-Bissau -2.0% India 4.6% Germany 1.5% Burundi -2.4% Chile 4.1% France 1.4% Haiti -2.4% Sri Lanka 4.1% Japan 1.2% Moldova -2.7% Singapore 4.1% Italy 1.1% Congo, Dem. Rep. -4.4% Switzerland 0.7%
Economic Freedom as a Measure of Sound Institutions
Economic Freedom as a Measure of Institutional Quality • Gains from trade, entrepreneurial discovery, and investment are largely dependent on institutions and policies supportive of voluntary exchange, market allocation, freedom to compete, and protection of people and their property from aggressors. • These ingredients comprise the foundation of economic freedom.
Measuring Economic Freedom • The Economic Freedom of the World (EFW) index is designed to measure the consistency of a nation’s institutions and policies with economic freedom. • Leading scholars, including Nobel laureates Milton Friedman, Gary Becker, and Douglass North, helped to develop the EFW index. • The EFW index uses 42 separate components to measure the consistency of a nation’s institutions and policies with personal choice, voluntary exchange, open markets, and protection of private property.
Measuring Economic Freedom • In order to achieve a high economic freedom (EFW) rating, a country must • provide secure protection of privately owned property, • provide evenhanded enforcement of contracts, • provide a stable monetary environment, • keep taxes low, • refrain from creating barriers to both domestic and international trade, and, • rely more fully on markets rather than governments to allocate goods and resources. • The EFW index reflects the institutional and policy factors that theory indicates are key sources of economic growth.
The Most and Least Free Economies of the World • EFW ratings are available for 122 countries during the 1990-2007 period. • The following slide indicates the ten highest and lowest rated economies, as well as the ratings of ten other large countries. • Hong Kong, Singapore, Switzerland, the United States, and New Zealand headed the list of the most persistently free economies. • The Democratic Republic of Congo, Myanmar, Guinea-Bissau, Rwanda, Algeria, and Niger had the least free economies.
EFW Ratings: 1990-2007 The Economic Freedom Rating for Top-, Middle-, and High-Rated Countries, EFW Index, Average 1990–2007 Top-Rated Countries Middle-Rated Countries Low-Rated Countries Hong Kong 8.9% Germany 7.6% Central African Rep. 4.7% Singapore 8.7% Chile 7.5% Ukraine 4.7% Switzerland 8.3% Japan 7.3% Congo, Republic of 4.6% United States 8.3% France 7.1% Zimbabwe 4.5% New Zealand 8.3% South Korea 6.6% Niger 4.5% United Kingdom 8.1% Mexico 6.5% Algeria 4.5% Canada 8.0% Indonesia 6.4% Rwanda 4.2% Ireland 7.9% Argentina 6.2% Guinea-Bissau 4.1% Luxembourg 7.8% China 5.8% Myanmar 4.0% The Netherlands 7.8% Brazil 5.3% Congo, Dem. Rep. 3.9%
Questions for Thought: 1. Why do economists believe the purchasing power parity (PPP) method is a more accurate way to compare cross-country incomes than comparisons based on exchange rates? 2. How large are the income differences across countries? Why are the per capita GDP figures likely to overstate the size of the income difference between high and low-income countries? 3. How do growth rates vary across countries? Are the rich countries getting richer while the poor are getting poorer?
Questions for Thought: 4. What is the Economic Freedom of the World (EFW) index designed to measure? What determines whether the rating of a country will be high or low on this index? 5. “Economic freedom is present if a country is a political democracy.” – Is this statement true?
Institutions, Policies, and Economic Performance
Economic Freedom and Performance • If institutions and policies are important, then countries that are economically free should outperform those that are less free. • When considering the impact of institutions, it is important to focus on income and long-term growth rather than short-term growth, which may reflect mostly the ups and downs of business cycle conditions.
$32,443 $14,513 $6,783 $3,802 Economic Freedom and Income 2007 GDP Per Capita, PPP(in constant 2005 dollars) SecondQuartile Most-FreeQuartile ThirdQuartile Least-FreeQuartile • The per person income for countries ordered by economic freedom rating is shown here by quartiles. • Note the strong positive linkage. Income per person in the freest quartile of countries was about eight times the figure for the least free.
2.4% 2.1% 2.3% 0.9% Economic Freedom and Growth Growth of GDP Per Capita 1990-2007(Annual %) SecondQuartile Most-FreeQuartile ThirdQuartile Least-FreeQuartile • The relationship between the economic freedom of a country and its growth rate during the 1990-2007 period is shown here. • Countries in the most free quartile grew at an annual rate of 2.4% compared to the 0.9% growth for the least-free quartile.
23.1% 22.1% 19.7% 18.0% 14.1% 9.6% Total Investment as % of GDP. 1980-2000 Private Investment as % of GDP. 1980-2000 Economic Freedom and Investment Economic Freedom and Investment as a Share of GDP(Groups are Average EFW Ratings for 1980-2000) > 7.0 5.0 – 7.0 < 5.0 • Here countries are divided into 3 groups, based upon their average EFW rating during 1980-2000. • Investment is positively linked to economic freedom. This is particularly true for private investment. • Private investment was 18% of GDP in the freest group, while only 9.6% of GDP for the least free group.
0.33% 0.27% 0.19% 0.17% Economic Freedom and the Productivity of Investment Change in Growth Rate per Percentage Point Change in Investment, 1980 – 2000 Private Investment, EFW > 7 GovernmentInvestment Private Investment, EFW 5-7 Private Investment, EFW < 5 • The estimated impact of a 1 percentage point increase in investment/GDP ratio on the annual growth rate during 1980-2000 is shown. • In the most free group a 1 percentage point increase in private investment enhanced long-term growth by 0.33%, compared to 0.19% for the least free group. • The estimated impact of government investment was even lower, 0.17%.
Economic Freedom– A Summary • Countries with institutions and policies more consistent with economic freedom (as measured by the EFW index) have … • achieved higher incomes per person, • grown more rapidly, • higher investment rates, and, • higher productivity of investment.
Is Institutional Change Possible?
The Influence of History • Research indicates that history matters. • Countries with colonial settlers who planned on staying tended to develop institutions and policies that protected individual property rights and limited the power of government. • The United States, Canada, Australia, and New Zealand provide examples.
The Influence of History • In contrast, colonizers settling in harsh climates or with short-term interests in the extraction of mineral resources were more likely to choose institutions that provided few limitations on the power of government and failed to provide for protection of ownership rights and unbiased enforcement of the law. • Even after independence, protective institutions have been largely absent in Africa and Latin America, where the European colonizers were primarily interested in resource extraction.
Three Factors That Now Make Institutional Change More Possible • While no country can entirely escape its past, at least three factors have increased the likelihood of institutional change. • The colonial era is over: Countries that were previously colonized by European powers are now in a position to make their own institutional and policy choices. • The collapse of communism has also expanded the opportunity for institutional change. • Substantial reductions in transportation and communication costs have increased the potential gains from the adoption of sound institutions and policies.
Recent Institutional Change and Economic Performance
Major Reformers During the 1960s • In the 1960s, Hong Kong and Singapore both began to liberalize their economies and by the 1970s they were among the world’s freest economies. • In 1960, Hong Kong & Singapore were poor; their income per capita was less than countries like Brazil, Argentina, and Venezuela. • Impressive growth has led to dramatic change. • The per capita incomes of Hong Kong and Singapore are now much greater than Latin American countries and greater than many high-income economies of Western Europe.
Major Reformers During the 1970s • In the 1970s, China and Chile each began instituting key reforms. At the time, both were among the least free economies in the world. The reform process has increased their EFW ratings substantially. • The growth of both has been impressive. • China has been the world’s fastest growing economy during the 1980-2007 period. • Chile’s 3.4% annual growth rate during the same period places it just outside of the top ten. Chile now has the highest per capita income in Latin America.
The Reformers of the 1980s Countries Beginning Reform During the 1980s BeginningYear of Change 2005EFWRating Growth1990-2007 Growth 1995-2007 Per CapitaGDP, 2007 Bangladesh 1987 6.0 3.1% 6.5% $1,172 7.2 1985 3.8% Botswana 4.9% $12,847 6.2 1985 2.3% Ghana 2.6% $1,260 7.8 1988 2.0% Iceland 3.2% $36,118 7.9 1987 5.1% Ireland 5.5% $41,036 7.5 1985 3.7% Mauritius 3.7% $10,668 8.5 1985 1.9% New Zealand 1.9% $25,281 8.1 United Kingdom 1980 2.1% 2.4% $33,717 7.4 3.0% Average 3.8% $20,262 • Data for the 8 major reformers of the 1980s is shown. • Since 1990, per capita income for the 1980s reformers has grown at an average annual rate of 3.0%. • The growth rates of Ireland, Botswana, and Mauritius have been particularly impressive.
Major Reformers of the Early 1990s • The following slide presents data for the diverse countries adopting major reforms in the early 1990s. • The average growth rate of these 12 countries was 3.5% during 1995-2007. • The growth of Estonia, Hungary, India, and Poland have been particularly impressive. • It will be interesting to see if these countries will be able to sustain the economic reforms and follow their growth record in the years immediately ahead.
Reformers of the Early 1990s Countries Beginning Reform During Early 1990s BeginningYear of Change 2005EFWRating Growth 1995-2007 Per CapitaGDP, 2007 Costa Rica 1991 7.4 3.0% $10,239 7.6 1994 El Salvador 1.3% $5,481 8.0 1995 Estonia 7.8% $19,327 7.5 1995 Hungary 4.1% $17,894 6.6 1990 India 5.2% $2,600 7.1 1991 Israel 1.6% $24,824 6.5 1994 Nicaragua 2.5% $2,427 7.2 Peru 1993 2.8% $7,400 6.9 1990 Poland 4.7% $15,634 6.3 1995 Tanzania 3.0% $1,141 6.5 1995 Uganda 3.6% $1,000 6.7 Zambia 1996 2.0% $1,283 7.0 Average 3.5% $9,104
Countries That Regressed Countries That Have Regressed Since 1990 BeginningYear of Change 2005EFWRating Growth 1995-2007 Per CapitaGDP, 2007 16.8 Table in word file Should fit in this space Congo, Rep. 1995 4.0 0.6% $3,316 4.9 2000 Venezuela 1.0% $11,480 2.9 1998 Zimbabwe -3.4% $1,813 3.9 Average -0.6% $5,536 • Here we show the record of the Republic of Congo, Venezuela and Zimbabwe – the only three countries with a substantial reduction in economic freedom during the 1990s. • All three of these economies experienced low growth rates during 1995-2007 with Zimbabwe exhibiting negative growth.
The Legal System, Growth, and Prosperity
Importance of the Legal System • A sound legal system is crucially important for the realization of gains from exchange, entrepreneurial discovery, and investment. • Almost everything people in the developed world consume is the result of gains from depersonalized exchange and extension in the size of the market. Without these gains, high levels of per capita income and modern living standards would be impossible. • But, these gains cannot be realized without a legal system that can be counted on to protect property rights and enforce contracts fairly. • Failure of a country's legal system to perform these functions places a constraint on prosperity.
The Legal System and Prosperity • The legal system area (of the EFW) indicates the degree to which a nation's legal structure is consistent with the protection of property rights, unbiased contract enforcement, independence of the judiciary, and rule of law principles. • The 24 countries with a legal system rating of more than 7.0 from 1980 to 2000 had an average per capita GDP in 2005 of $29,404. • In contrast, the 21 countries with a legal system rating of less than 4.0 from 1980 to 2000 had an average 2005 per capita GDP of $3,254, about one-ninth the average for the countries with quality legal systems.
The Legal System and Prosperity • Further, the 24 high-quality legal system economies had an average annual real growth rate of 2.3% during the 1980-2005 period. • In contrast, the average growth of per capita GDP for the group with poor quality legal systems was only 0.6%. • All of this suggests that it will be virtually impossible for countries with legal systems that fail to protect property rights and enforce contracts to move up to even lower-middle income status.
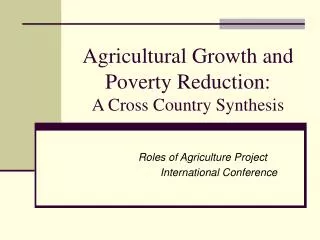
Rich and Poor Nations Revisited
Rich and Poor Nations Revisited • Of the list of countries that either grew most rapidly or regressed & experienced falling incomes during the last 3 decades, countries with low 1980 per capita income dominate the list. • When low-income economies have sound institutions, they can grow rapidly because: • they can merely copy or emulate technologies and business practices that have been successful in high-income countries • the rate of return on investment in these low-income countries will generally be higher than in capital rich, more advanced economies
Rich and Poor Nations Revisited • In order for a low-income country to benefit from the borrowing of technologies and investment capital influx, it must have sound institutions. • Many low-income economies continue to perform poorly and even regress because their institutions and policies stifle gains from trade, entrepreneurship, and investment.
Economic Rules and Political Decision Making
Politics and Sound Institutions • Economics provides direction with regard to institutions and policies that will lead to wealth creation, growth, and prosperity. • But, these institutions are an outgrowth of the political process and there is no assurance that political decision-making will lead to sound economic institutions.
Politics and Sound Institutions • Democratic political decision-making will often lead to rules that encourage unproductive and counterproductive actions because of: • shortsightedness: bias toward adoption of unproductive programs providing immediate, highly visible benefits at the expense of difficult-to-identify future costs • special-interest politics: political incentives that lead politicians to “trade” favors to interest groups for political contributions to help them win the next election • rent-seeking and favoritism: activities that provide favors to some at the expense of others, that encourage people to divert resources away from productive activities and toward lobbying, campaign contributions, and other forms of political favor seeking
Politics and Economics • Achievement and maintenance of political power often conflict with sound economics. • In recent decades, a wide variety of political processes have generated moves toward economic institutions more consistent with prosperity. • Economists do not fully understand the linkage between political decision-making and the adoption of economic reforms consistent with growth and prosperity. • This is a subject of current research that will enrich the future study of economics.
Questions for Thought: 1. How do the income levels and growth rates of countries with institutions and policies more consistent with economic freedom compare with those that are less free? Is this surprising? Why or why not? 2. From the viewpoint of economic growth, why is the legal structure of a country important? What are some of the key attributes of a legal system that will encourage economic growth. 3. The fastest growing economies during the past quarter of a century were generally poor in 1980. Is this surprising? Why or why not?
Questions for Thought: 4. (a) When property rights are well defined and enforced, what determines if an exchange will take place in a market economy? (b) When political decisions are made democratically, what determines whether a political action will be undertaken? Is the difference in the structure of incentives accompanying markets and that of democratic political decision making important? Explain.
Questions for Thought: 5. Do we count on majority rule to protect civil liberties such as the right to free speech, freedom of the press, the right to assembly, and religious freedom? Should we count on majority rule to defend economic rights like protection of one’s property, freedom to trade, and the freedom to compete? Discuss each of these questions.
Questions for Thought: 6. Compared to countries with low levels of economic freedom, countries that have a larger degree of economic freedom tend to have: a. higher per capita income levels, but slower rates of economic growth. b. lower per capita income levels, but more rapid rates of economic growth. c. both higher per capita income levels and more rapid growth rates. d. both lower income levels and slower rates of economic growth.