BOSS: Stochastic Simulation of Biological Systems Utilizing the Gillespie Method
230 likes | 338 Vues
BOSS (Biological Operations Simulated through Stochastic Simulation) is a cutting-edge software developed to investigate biological systems using stochastic simulation, particularly the Gillespie method. Our objectives included simulating simple diffusion across cell membranes, modeling the Lotka-Volterra predator-prey dynamics, and exploring the substrate binding and inhibition of HIV-1 protease. This research highlights the advantages of stochastic modeling over deterministic ordinary differential equations in accurately capturing small-scale biochemical interactions and behaviors in biological systems.

BOSS: Stochastic Simulation of Biological Systems Utilizing the Gillespie Method
E N D
Presentation Transcript
BOSS: Biological Operations modeled through Stochastic Simulation By: Logan Brosemer, Juliana Hong, Raashmi Krishnasamy, Danial Nasirullah, Rosalie Sowers, Madeleine Taylor-McGrane, and Nalini Ramanathan
Introduction Objectives: • Research stochastic simulation • Develop a simulator using the Gillespie method • Test our simulator, BOSS, on several biological systems: • Simple diffusion across a cell membrane • Lotka-Volterra system • HIV-1 protease substrate binding and inhibition
Ordinary Differential Equations vs. Stochastic Simulation Algorithms ODE • Ordinary Differential Equations • Deterministic • Static equations • Continuous timescale • Efficiently depicts large-scale systems SSA • Stochastic Simulation Algorithms • Probabilistic • Factors that vary according to probabilities • Randomness • Accurately depicts small-scale systems
Diffusion Example A1 Reaction Scheme A2
Model of Simple Cellular Diffusion Ordinary Differential Equations Stochastic Simulation Algorithm
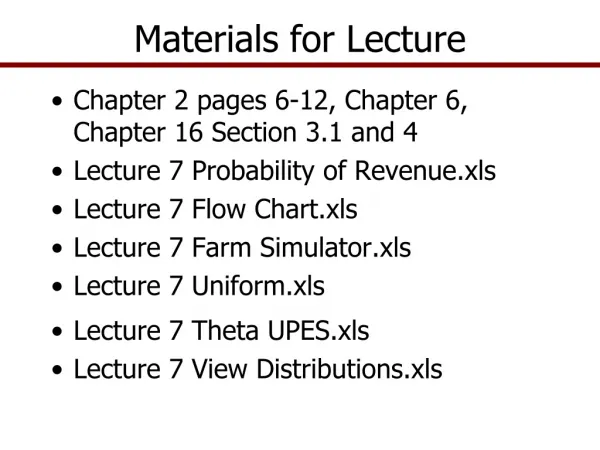
Input • i = iterations • t = time • of = output frequency • Molecules = initial molecule counts • Reactions = reactions and rates • Output = names of output files for each molecule • Plot = whether or not data will be plotted
Why Gillespie? • No “Master Equation” • Efficient • Simple
How Gillespie Works Loops through two actions • Finds next reaction • Propensities • Number of Molecules • Random number • Finds time of next reaction • Propensity • Random number
Test cases 1. Simple Diffusion Across a Cell Membrane 2. Lotka-Volterra 3. HIV-1 Protease Examples a. T1 and T2 b. E3, E4 and E5
Lotka-Volterra: Wolves and Rabbits Equations: R -> 2R [k1] R + W -> 2W [k2] W -> nil [k3] • k values = rate constant of event • k1 = rabbit birth • k2 = rabbit consumption and wolf birth • k3 = wolf death BOSS created a graph that matches the typical cyclic pattern of Lotka-Volterra Systems.
Our Main Application: HIV-1 Protease http://en.wikipedia.org/wiki/HIV-1_protease
HIV-1 Protease: An Overview • General Information • HIV -1 - Human Immunodeficiency Virus Type 1 • HIV-1 Protease - enzyme that plays a crucial role in the replication of HIV-1 • No cure for virus, drugs that inhibit HIV-1 Protease are currently being tested • HIV Protease Mutations and Drug Resistance • Mutations in the enzyme → changes shape of enzyme → resistance to specific inhibitors • Some mutated versions of HIV-1 Protease: • G48V • L90M • G48V/L90M
Different Test Groups • T1 and T2 Groups • focused on “base cases” • T1 - tested different inhibitors on Wild Type and Mutant Type HIV-1 Protease • T2 - tested one substrate on Wild Type • E3, E4, and E5 Groups • experimental groups - “inductive cases” • E3 - change in number of molecules • E4 - one substrate and different inhibitors on Wild Type • E5 - one inhibitor, one substrate, different mutated forms of HIV protease
Michaelis-Menten System of Equations Substrate Equations: Enzyme + Substrate→ Enzyme-Substrate Complex [Kon] Enzyme-Substrate Complex→ Enzyme + Substrate [Koff] Enzyme-Substrate Complex→ Enzyme + Product [Kcat] Inhibitor Equations: Enzyme + Inhibitor → Enzyme-Inhibitor Complex [Kon] Enzyme-Inhibitor Complex→ Enzyme + Inhibitor [Koff] • Kon = rate constant of creation of ES or EI • Koff = rate constant of dissociation of ES or EI • Kcat= rate constant of catalysis
T1 and T2 Data T1: Inhibitor Alone T2: Substrate Alone
E3: Number of Molecules and Fluctuation Small Number: Large Number:
E4: Testing Different Inhibitors Ritonavir (Best Inhibitor): Nelfinavir (Worst In hibitor): Little Product Produced A Lot of Product Still Produced Little product produced A lot of product produced
E5: Mutations and Inhibitor Activity G48V/L90M: Wild Type: L90M: A lot of product produced Less product produced Inhibitor still effective (even despite mutation in L90M) Inhibitor no longer effective with mutation
Discussion Future Developments • Extensive testing • Graphical user interface • Internal unit conversion capabilities • Tau-leaping Applications to Other Systems
Acknowledgements We would like to acknowledge the following individuals and groups… • Dr. Markus Dittrich • Maria Cioffi • Dr. Gordon Rule • Dr. Barry Luokkala • PGSS Alumni Association and Donors • Corporate Sponsors: