Download
1 / 23
230 likes | 334 Vues
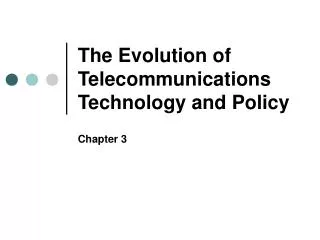
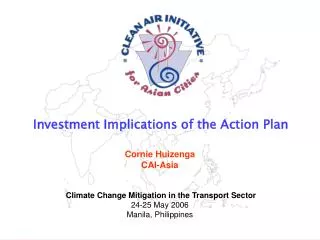
Explore the role of telecommunications in modern economies, the development of advanced services, and the impact on system efficiency, locational considerations, and social connectivity. Learn about infrastructure types, technical efficiency, and the evolution of telecommunications systems. Discover how telecommunications influence transportation, teleworking trends, and the integration with other sectors. Gain insights into the potential of intelligent transportation systems and the societal benefits of telecommuting. This project update provides a comprehensive overview of the implications of telecommunications technology investment.

E N D
Implications of Telecommunications Technology Investment Jamie Montague Fischer Messner Project Update August 2009
Overview • Introduction to the Information Economy • Brief History of Telecommunications Technology • Locational Considerations and System Efficiency • Relationship with Transportation • Teleworking and Social Connectivity • Intelligent Transportation Systems • Summary
The Information Economy Telecommunications has been seen as the foundation for “post-industrial” economies. Shift from manufacturing to service focus Shift from financial to knowledge capital as fundamental resource Figure 1: The Telecommunications Industry (From Anttalainen, 2003) SOURCES: Goddard, J., and Gillespie, A. (1986) “Advanced Telecommunications and Regional Economic Developmnet” The Geographical Journal., 152(3) Anttalainen, T. (2003) Introduction to telecommunications network engineering: 2nd Edition.
Telecom Technology Timeline Figure 2: Development of Telecommunications Systems and Services (From Anttalainen, 2003) SOURCE: Anttalainen, T. (2003) Introduction to telecommunications network engineering: 2nd Edition.
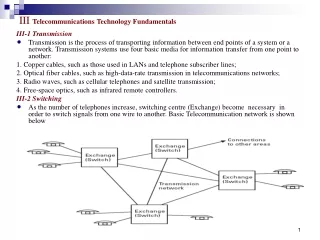
Technical Efficiency Basic telecom services: “plain old telephone service” (POTS) Advanced services: broadband services such as digital subscriber line (DSL), cable modem, fiber, wireless, satellite, and broadband over powerline (BPL). Infrastructure Types: WirelineSystem: Transmission through copper wire or fiber optic cable. Consists of customer services equipment, transmission facilities, and switches. Land-basedWireless: Transmits voice and data using radio waves, to mobile or stationary receivers. Consists of transmitters, receivers, repeaters, plus switches and points of interconnection to the wireline network. Satellite: Communications satellites can be used to provide different types of services such as radio, telephone, data, television, and imaging. Capable of providing services over wide geographic areas, and often used in underserved or remote areas. Cable: Distributes signals, via coaxial or fiber optic cable, or satellite. Cable operators may use poles, a microwave link, or underground cable. SOURCE: FCC (2006) Lands of Opportunity: Bringing Telecommunications Services to Rural Communities. Consumer and Governmental Affairs Bureau.
System Efficiency (1) Figures 3 & 4: Zip codes with high-speed internet providers as of June 30, 2008 (From FCC 2009) SOURCE: FCC (2009)High-Speed Servoces fpr Omtermet Access: Status as of June 30, 2008. Industry Analysis and Technology Division, Wireline Competition Bureau.
System Efficiency (2) FCC “Lands of Opportunity: Building Rural Connectivity Outreach Program” To enable the social and economic development of rural regions by fostering Distance learning, E-commerce E-government Telemedicine Through broadband telecommunications services Figures 5: Target areas for the FCC “Lands of Opportunity” Program SOURCE: FCC (2006) Lands of Opportunity: Bringing Telecommunications Services to Rural Communities. Consumer and Governmental Affairs Bureau.
Integration with other Sectors Transportation Teleworking Social networking, online commerce, etc. Intelligent Transportation Systems (ITS)
Teleworking (1) Five motivations to telework: Work Family Leisure/ independence Commuting Ideology (pro-environment) Figures 5 & 6: Percentages of drivers who can telecommute (From Mokhtarian 1998) SOURCE: Mokhtarian, P. (1998) “A Synthetic Approach to Estimating the Impacts of Telecommuting on Travel” Urban Studies, 35(2)
Teleworking (2) • 0.5 - 1% net reduction in VMT due to telecommuting. • Workplace Effects • Increased productivity of teleworkers (+) • Decreased absenteeism of teleworkers (+) • Decreased productivity of non-teleworkers (-) SOURCES: Butler, S., Aasheim, C. and Williams, S. (2007) “Does Telecommuting Improve Productivity?: Seeking Solid evidence of demonstrable productivity gains.” Communications of the ACM, 50(4) Mokhtarian, P. (1998) “A Synthetic Approach to Estimating the Impacts of Telecommuting on Travel” Urban Studies, 35(2)
Other Human-element Transportation Impacts Telecomunications infrastructure can induce travel demand through: Social Networking Increased awareness of activities of interest Expanding network of personal and business relationships Stimulation of economic growth, which stimulates travel Reduced disutility of travel by making travel time more productive SOURCE: Mokhtarian, P. (1998) “A Synthetic Approach to Estimating the Impacts of Telecommuting on Travel” Urban Studies, 35(2)
Intelligent Transportation Systems (1) Traditional ITS Technologies: Ramp Metering Transit Information Electronic Payment and Credentialing Transportation Management Centers Figure 7: Los Angeles Metro Rapid Real-Time Arrival Sign (From USDOT) Figure 8: Ramp metering diagram (From New Zealand Transit Agency) SOURCE: Row, S. (2009) “Future of the ITS Program” Presentation to the ITS America 2009 Annual Meeting, Plenary Session: “A New Era in Transportation – A Federal Perspective.” Research and Innovative Technology Administration, USDOT.Tuesday June 2, 2009.
Intelligent Transportation Systems (2) Figure 9: Intellidrive systems (formerly “Vehicle Infrastructure Integration” (VII)) consist of Vehicle to Vehicle (V2V), Vehicle to Infrastructure(V2I), and Vehicle to Device (V2D) Wireless communications. SOURCE: http://www.its.dot.gov/intellidrive/intellidrive_overview.htm
Vision for 2009 ITS Strategic Plan A national, multimodal surface transportation system that features a connected transportation environment among vehicles, the infrastructure, and portable devices to serve the public good by leveraging technology to maximize safety, mobility, and environmental performance. Intelligent Transportation Systems (3) SOURCE: Row, S. (2009) “Future of the ITS Program” Presentation to the ITS America 2009 Annual Meeting, Plenary Session: “A New Era in Transportation – A Federal Perspective.” Research and Innovative Technology Administration, USDOT.Tuesday June 2, 2009.
ITS STRATEGIC INITIATIVES (1) SAFETY Outcome: Significant reduction in crashes, injuries, fatalities and associated economic costs Goal: Transformative safety through vehicle and infrastructure connectivity The safety benefits of a project are expressed in terms of expected reductions in injuries and fatalities on the transportation network resulting from the project in question. These reductions are converted into monetary terms using standardized values. Estimated 1.9% reduction in total annual vehicle crashes by 2050. Figure 10: Prevented crashes as ITS is deployed
ITS STRATEGIC INITIATIVES (2) MOBILITY Goal (1): Capture complete, real-time information on all roads and all modes to support transformational system performance. Outcome: Significant improvements in mobility that result in more sustainable and livable communities Goal (2): Achieve transformational transportation management and system performance through vehicle and infrastructure connectivity. Goal (3): Realize “next generation” electronic payment systems that support transformational system performance Mobility benefits refer to the improved ability of travelers to reach destinations and to reduce the required amount of travel time, for example by reducing congestion delays. Time savings and delay reductions, measured in hours, are converted to dollar terms using standardized values. These values are typically pegged to average wage levels, since wages represent the marketplace trade-off between time and money. Estimated 1.7 million hours of delay reduction per year due to signal timing.
ITS STRATEGIC INITIATIVES (3) ENVIRONMENT Outcome: Reduced transportation impact on the environment and improved livability Goal: Enable environmental management through vehicle and infrastructure connectivity Environmental benefits stem from reduced vehicle emissions and other pollutants, for example from reductions in vehicle idling time. Again, changes in quantities (e.g. tons of carbon monoxide) are converted into monetary terms using standardized values. Estimated 1.1 million gallons of gasoline saved, and 9,600 tons of CO2 emissions avoided per year due to signal timing. SOURCE: Row, S. (2009) “Future of the ITS Program” Presentation to the ITS America 2009 Annual Meeting, Plenary Session: “A New Era in Transportation – A Federal Perspective.” Research and Innovative Technology Administration, USDOT.Tuesday June 2, 2009.
ITS BCA (1) COST Summary • Initial infrastructure installation is estimated to cost $5 Billion, spent over a 5 year period. • Installation of VII equipment and systems on all sold vehicles will cost over $1 Billion per year at full deployment. • Total present value of all implementation costs estimated at $27.3 Billion, including • Initial infrastructure installment • On-board vehicle equipment • Operations and maintenance costs SOURCE: DOT/RITA (2008) “Vehicle-Infrastruction Integration (VII) Initiative Benefit-Cost Analysis: Version 2.3 (Draft)”
ITS BCA (2) Benefit Summary • Present value sum of benefits from eight of the applications of VII estimated at $44.2 Billion. Benefits from other applications cannot yet be calculated and are presently excluded. • About 95% of benefits result from reduced crashes, with other 5% from improved mobility and other “positive private and societal impacts.” • Net Benefits: $16.9B • Benefit Cost Ratio: 1.6 to 1 SOURCE: DOT/RITA (2008) “Vehicle-Infrastruction Integration (VII) Initiative Benefit-Cost Analysis: Version 2.3 (Draft)”
ITS Deployment Timelines (1) Figure 11: Trajectory of VII equipped light vehicle fleet over time SOURCE: DOT/RITA (2008) “Vehicle-Infrastruction Integration (VII) Initiative Benefit-Cost Analysis: Version 2.3 (Draft)”
Public-Private Partnership (1) • Infrastructure development is primarily managed by the public sector, but vehicle stock is manufactured in the private sector. • Public-private partnership is required to accommodate timely, national deployment, and it has the potential to maximize both public and private benefits. SOURCE: FHWA (2005) Public-Private Agreements/Arrangements Associated with VII Implementation
Public Private Partnership (2) Figure 12: New service relationships required by VII implementation SOURCE: FHWA (2005) Public-Private Agreements/Arrangements Associated with VII Implementation