WELL CONTROL
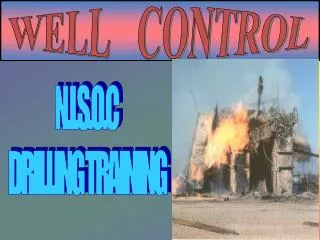
WELL CONTROL. N.I.S.O.C DRILLING TRAINING. ON JANUARY 10, 1901, THE LUCAS GUSHER BLEW IN AT SPINDLETOP, NEAR BEAUMONT, TEXAS. The Hamill Brothers Had Started The Hole 3 Months Earlier For Captain A. F. Lucas, And 6-inch Casing Had Been Set At 880 Feet

WELL CONTROL
E N D
Presentation Transcript
WELL CONTROL N.I.S.O.C DRILLING TRAINING
ON JANUARY 10, 1901, THE LUCAS GUSHER BLEW IN AT SPINDLETOP, NEAR BEAUMONT, TEXAS. The Hamill Brothers Had Started The Hole 3 Months Earlier For Captain A. F. Lucas, And 6-inch Casing Had Been Set At 880 Feet After Minor Indications Of oil In The Next 7 Days, The Well Had Been Deepened By 140 Feet To , 1020 Feet, A Much Faster Rate Than Before. Running In A New Bit, The Crew Had 700 Feet Of 4-inch Drill Pipe In The Hole When The Well Started To Unload; That Is, Mud Started Flowing From The Casing. After Several Hard Kicks, Well Pressure Blew The Drill Pipe Out Of The Hole. Soon A Stream Of Oil And Gas Was Spraying More Than 100 Feet In To The Air, Producing By Some Estimates 75,000 To 100,000 Barrels Of Oil Per Day. Most Of The Signs Of A Developing Blowout Were Observable On The Lucas Well: Shows Of Oil And Gas In The Mud Drilling Break (Faster Drilling) Flow Of Mud From The Well Pit Gain
Hydrostatic pressure hydrostatic pressure is defined as the pressure exerted by a fluid column. The magnitude of the pressure depends only on the density of the fluid and the vertical height of the column. The size and shape of the fluid column do not affect the magnitude of this pressure pressure = fluid density x vertical height of the fluid column
HP = C x MW x TVD where: HP = Hydrostatic Pressure (Ph)(psi or Pounds Per Square Inch) MW = Fluid Density, or Mud Weight (1bs/gal or ppg or Pounds Per Gallon) TVD = True Vertical Depth of the Fluid Column (Feet or Ft) C = 0.052: Conversion factor used to convert density to pressure gradient (psi /ft Per 1bs/gal) is derived as follow: A cubic foot contains 7.48 US gallons A fluid weighing 1 ppg is therefore equivalent to 7.48 lbs /cu.ft The pressure exerted by one foot of the fluid over the base would be : 7.48 lbs / 144 sq.ins = 0.052 psi Example: Calculating hydrostatic pressure the hydrostatic pressure exerted by a 10-foot column of fluid with a density of 10 ppg is: hydrostatic pressure = 0.052 x density (10 ppg) x height (10 ft) = 5.2 psi 12” 12” 12”
PRESSURE GRADIENT Pressure gradient is defined as the pressure increment per foot of depth . Water, for example , will increase the hydrostatic pressure by 0.433 psi for every foot - of hole. PG = C x MW PG = Pressure Gradient psi / ft MW = Fluid Density lbs/gal C = 0.052 conversion constant psi /ft / lbs/gal
OVER BURDEN PRESSURE Overburden Pressure is the Result Of The Combined Weight Of The Formation Matrix (Rock) And The Fluids (Water, Oil, And Gas) in the Pore Spaces Overlying The Formation Of Interest. The Average Value Of Overburden Pressure Gradient (OPG) is Often Assumed To be1.0 psi/ft .Actually, it me be as high as 1.35 psi/ft in some areas , and lower than 1.0 psi/ft in others.
PORE PRESSURE The magnitude of the pressure in the pores of a formation , known as the formation pore pressure (or simply formation pressure ), Formation Pressures Vary Greatly, And Depend Upon Reservoir Characteristics. They Can Be Divided In To Three Categories: Normal Formation Pressure Subnormal Formation Pressure Abnormal Formation Pressure
NORMALFORMATIONPRESSURE Normal Formation Pressure Is Equal To The Hydrostatic Pressure Of Water Extending From The Surface To The Subsurface Formation Of Interest.this is because sedmentary beds were originally deposited in a water environment. Thus the normal pressure gradient in any area will be equal to the hydrostatic pressure gradiant of the water that occupies the pore space of the formations in that area. HENCE, 0.433 PSI/FT < NORMAL FORMATION PRESSURE GRADIENT < 0.465 PSI / ft
ABNORMAL FORMATION PRESSURE ABNORMAL FORMATION PRESSURE IS ANY FORMATION PRESSURE GREATER THAN THE CORRESPONDING NORMAL FORMATION PRESSURE. Formation pressure gradient > 0.052 x 8.90 psi / ft > 0.465 psi / ft
Causes of abnormally high formation pressure are: Depositional causes Diagenesis Piezometric surface Tectonic causes Structural causes
DEPOSITIONAL CAUSES. INSUFFICIENT COMPACTION - as sediments are deposited, the pore pressure is normal as pore fluid is in contact with the overlaying seawater. as sedimentation continues, older sediments compact (due to increase in overburden pressure) and fluids are expelled from the older sediments. as long as equilibrium exists between rate of compaction and rate of fluid expulsion from sediments, and the expelled water can escape to surface or in other porous formation, pore pressure remains normal (hydrostatic). in some cases, rate of compaction is more than the rate of pore fluid expulsion.
DIAGENESIS diagenesis is the process whereby the chemical nature of the sediment is altered due to increasing pressure and temperature as the sediment is buried deeper. gypsum converts to anhydrite plus free water. the volume of water released is approximately 40 % of the volume of gypsum. if the water cannot escape then overpressures will be generated.
PIEZOMETRIC SURFACE • A PIZOMETIC SURFACE IS AN IMAGINARY LEVEL TO WHICH THE GROUND WATER WILL RISE IN A WELL. THE WATER TABLE IN AN AREA IS AN EXAMPLE OF A PIEZOMETRIC SURFACE. IF THE SURFACE ELEVATION IS HIGHER THAN PIEZOMETRIC SURFACE LEVEL, SUBNORMAL PORE PRESSURES ARE MOST OFTEN ENCOUNTERED (SEE FIGURE BELOW).
Structural causes Any structure such as an anticline or dome may have abnormally high pressures above the oil- water or gas –water contact in the oil or gas zone because hydrocarbons are less dense than water. If the anticline or dome is large ,abnormal pressures may be quite high
TECTONIC CAUSES TECTONIC FORCES MAY CAUSEABNORMAL PRESSURES DUE TO FOLDING AND FAULTING DUE TO SALT DIAPIRISM. DIAPIRISM IS THE UPWARD MOVEMENT OF LOW DENSITY PLASTIC FORMATIONS (SEE FIGURE BELOW).
Subnormal formation pressure Subnormal Formation Pressure Is Any Formation Pressure Less Than the Corresponding Normal Pressure. Formation PressureGradient < 0.052 X 8.33 ppg < 0.433 Psi / ft
Causes of subnormal formation pressure are: Depleted Reservoirs Piezometric Surface Tectonic Compression
DEPLETED RESERVOIRS Producing Large Volumes Of Reservoir Fluids Causes A Decline In Pore Pressure As The Fluids In The Reservoir Expand To Fill The Void Spaces Created Because Of Production. Example The original reservoir formation pressure in oil field “A” was 3250 psi at a depth of 7000 ft vertical depth. This equates to a formation pressure gradient of 0.465 psi , which is the normal hydrostatic gradient . After producing many years from the field , the reservoir formation pressure dropped to approximately 2525 psi .this gives a subnormal pressure gradient of 0.36 psi/ft .
PIEZOMETRIC SURFACE • A PIZOMETIC SURFACE IS AN IMAGINARY LEVEL TO WHICH THE GROUND WATER WILL RISE IN A WELL. THE WATER TABLE IN AN AREA IS AN EXAMPLE OF A PIEZOMETRIC SURFACE. IF THE SURFACE ELEVATION IS HIGHER THAN PIEZOMETRIC SURFACE LEVEL, SUBNORMAL PORE PRESSURES ARE MOST OFTEN ENCOUNTERED (SEE FIGURE BELOW).
TECTONIC COMPRESSION During A Lateral Compression Process Acting On Sedimentary Beds, Up warping Of Upper Beds And Down warping Of Lower Beds May Occur. The Intermediate Beds Must Expand To Fill The Voids Left By This Process Causing Subnormal Pressures, Due To The Increase In Pore Volume (See Figure Below).
FRACTURE PRESSURE Fracture Pressure is the amount of pressure it takes to permanently deform ( fail or split ) the rock structure of a formation . Overcoming formation pressure is usually not sufficient to cause fracturing .
GRADIENT PSI/ft FRACTURE PRESSURE PORE PRESSURE MUD PRESSURE FORMATION
leak-off test this test is usually made just after drilling 10 to 30 feet through a casing shoe . It measures the maximum mud weight or surface pressure the formation at the casing shoe will withstand before fluid is forced into it. The well is shut in by closing the blowout preventer. Pressure is increased by pumping slowly into the well. At a certain point pressure will being to drop off , indicating that the exposed formation is taking on significant amounts of mud . The fracture is the total of the surface pumping pressure and the hydrostaic pressure at the casing shoe
Maximum Allowable Annulus Surface Pressure this is the maximum pressure that can be tolerated in the annulus , without risking a possible formation rupture at or below the casing shoe . MAASP = Pressure required to fracture the formation mines hydrostatic pressure created by the column of mud in the annulus . ( Formation fracture gradient – MW gradient ) * Depth of CSG Fracture gradient = 0.8 psi/ft MW gradient = 0.52 psi/ft Depth of CSG = 8200 ft MAASP = ( 0.8 – 0.52 ) * 8200 MAASP = 2290 psi
well bore and the ‘U’ Tube The U-Tube A U- tube is acombination of two vertical tubes, column A and B , connected at the bottom such that the pressure at the bottom of each tube is the same A B PA = P B
U Tube in a wellbore A well bore is similar to a U- tube . The fluid column inside the drill string can be considered column A, and the fluid column inside the drill annulus can be considered column B. pump choke A B PA = P B
home work What will be the gain in the pits , and how far will the slug fall if the mud weight is 10 ppg ,the pipe’s capacity is 0.0178 bbl/ft ? The volume of the slug is 30 bbls and weighs 11 ppg .
FLOW LINE 1500 ft Fluid column A : Density 11 ppg Drill string Fluid column B : Density 11.5 ppg Annulus 2500 ft BHP= Hydrostatic pressure of drilling fluid column inside drill string
FLOW LINE FLOW LINE Drill string Annulus BHP= Hydrostatic pressure of drilling fluid column inside Annulus BHP= Hydrostatic pressure of drilling fluid column inside drill string
Static well bore with External Pressure In shut in well conditions , the BHP can be calculated using the following equations BHP = HPd + SIDPP BHP = HPa + SICP
SIDPP SIDPP Mud Pump Mud Pump SICP CHOKE SICP CHOKE Drill string Annulus BHP= Hydrostatic pressure inside Annulus +SICP FORMATION ORESSURE FORMATION ORESSURE BHP= Hydrostatic pressure inside drillstring +SIDPP
Pump pressure Mud Pump BHP= Hydrostatic pressure inside drillstring +pump pressure – pressure loss inside drilling and bit CHOKE Friction pressure loss in the drillstring acting against pump pressure FORMATION ORESSURE The well bore in dynamic condition – drill string side
Pump pressre Mud Pump BHP= Hydrostatic pressure inside Annulus +surface casing pressure +pressure loss inside annulus CHOKE SICPsurface casing pressure Friction pressure loss in the annulus acting downwards FORMATION ORESSURE The well bore in dynamic condition – annulus side
Influx Gradient Evaluation SIDPP + HPdp = SICP + ( MG ×H ) + ( IG ×h ) SIDPP + ( MG × H ) + ( MG × h ) =SICP + ( MG×H ) + ( IG × h ) ( MG × H ) + ( MG × h ) - ( MG×H ) - ( IG × h ) = SICP-SIDPP IG =MG - GAS = TO 0.15 OIL&GAS = F/ 0.15 to/ 0.4 WATER & SALT WATER ABOVE 0.4 SIDPP SICP H H = h h
Kick A kick is the undesired entry of formation fluids into the well bore Blowout A blowout is the uncontrolled flow of gas , oil , or other formation fluids Sometimes ,formation fluids from a reservoir formation at high pressure can flow into another underground formation that is at a lower pressure and different depth . This kind of uncontrolled flow is an underground blowout and can be very difficult to control.
Kick causes • Not keeping the hole full • Swabbing • Overpressure ( abnormal pressure ) formations • Lost circulation • Gas/oil/water cut mud
1- Not keeping the hole full during tripping As the drill string comes out of the well the level of drilling fluid in the annulus drops by a volume equal to the volume of drill string removed. If the fluid level is allowed to drop too far , the hydrostatic pressure on the formation is reduced below formation pressure , which allows formation fluids to enter the well bore. Note that the majority of all kicks worldwide occur during tripping operation
Casing capacity = 0.0729 bls/ft Metal displacement = 0.0075 bls/ft Annular volume 0.0476 bls/ft Pipe capacity = 0.0178 bls /ft Mud gradient = 0.572 psi / ft 1 stand = 94 ft Bottom hole pressure (BHP) will be reduced by pulling wet pipe and NOT filling the hole this allows the mud level to drop therefore reducing the hydrostatic pressure How many stands would have to be pulled wet to remove a 50 psi overbalance and allow the well to flow ?
2- swabbing • Swabbing occur when the drill string is pulled from the well , producing a temporary bottom hole pressure reduction . This can lead to an under balanced condition , allowing formation fluids to enter the well bore below the drill string • Balled-up bottom hole assembly • Pulling pipe too fast • Poor drilling fluid properties • Large OD tools
3- Abnormal pressure reservoir • 4- Lost circulation Causes of lost circulation • High density of drilling fluid • Going into hole too fast (surging) • Pressure due to annular circulation friction
5- cutting of drilling fluid with oil , gas , or water When the bit penetrates a porous formation the fluids contained in the formation (gas, oil , or water ) escape and mix with the drilling fluid , Cutting drilling fluid (contaminating with the low-density formation fluid ) reduce the density of the fluid in the annulus and causes a subsequent loss of hydrostatic pressure.
Kick Indicators • Primary kick Indicators • Secondary kick Indicators
Primary Kick Indicators • Increase in return flow rate • Increase in pit volume • Insufficient hole fill during tripping • Positive flow check
secondary Kick Indicators • Drilling break • Decrease in circulating pressure with a corresponding increase in circulating rate • Increase in gas cutting, oil cutting , or chlorides
Early warning signs( home work) • Increase in background, connection, and trip gas • Increase in the chlorides content of the mud • Changes in the size and shape of cuttings • Unaccounted –for fluid loss while tripping • Increasing fill on bottom after a trip • Increase in flow line temperature • Increase in rotary torque • Increase tight hole on connection • Decrease in D-exponent Most of these signs are related to the indication of a transition zone prior to drilling into an abnormal pressure formation
0 0 BALANCED STATIC CONDITION Figure shows a balanced U-tube situation with fluid of the same density in the annulus and drill pipe sides. 10PPG 10PPG 2600 5200 Depth = 10000 ft Shoe depth = 5000 ft Mud wt = 10 ppg