Download
1 / 49
490 likes | 520 Vues
This report outlines the results of a community survey conducted in Phillipi East to gather public input on service delivery and development priorities. The survey aimed to establish a demographic profile, identify community preferences, and assess willingness to pay for services. Data includes respondent demographics, attitudinal segments, and satisfaction with key services.

E N D
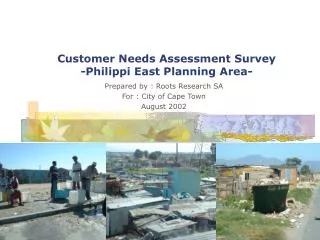
Customer Needs Assessment Survey-Philippi East Planning Area- Prepared by : Roots Research SA For : City of Cape Town August 2002
Background and Objectives To ensure meaningful public input in the Phillip East planning process it was proposed that a community survey be conducted to obtain community input around service delivery and development priorities. The objective of the survey were to: • Establish a demographic and socio-economic profile of the community in terms of household size and composition, education, income and work status • Identify the priorities and preferences of the community by measuring perceptions of the importance of various services as well as levels of customer satisfaction for current service provision • Gauge the ability or willingness to pay for various levels of services
Methodology • The face-to-face methodology with a random selection of households in the area was used. A map was provided of the area and a set number of interviews were conducted within each sampling point identified. This method ensured that the whole area was covered. • All interviews were conducted in the home language of the respondents by interviewers who are both ethnically and linguistically matched to the respondents
Demographic profile of respondents cont… 81% 81% of respondents earn less than R2500 per month
Demographic profile of respondents cont… • 99% of the respondents were Xhosa • 11% own a car • Majority shop in Mitchell’s Plain (63%) • 45% of the respondents work (full-time or part-time) 45%
Attitudinal segments • Respondents were exposed to a list of statements and asked to indicate their level of agreement on the various statements. • This exercise enabled us to segment the sample into three distinct groups, namely, Willing Payers, Neutrals and Begrudging Payers
Defining statements for attitudinal segments- Willing Payers • Non-payment of services will affect the quality of services rendered in my area • Paying for a service is like paying any other account • Without payment of services there will be no services in our area • I’m so used to the services in my area I will feel its absence if no longer there These statements were strongly agreed to by Willing Payers and less so by other segments The Willing Payers are the largest of the three segments comprising mainly females. An equal spread of ages in this segment, with most living in formal dwellings. By comparison, the highest percentage of post matric qualifications present in this group. They have a positive attitude towards payment of services and understand that without payment there is likely to be deterioration of services or at worst no services in the area at all
Defining statements for attitudinal segments- Neutrals • It is necessary to pay for services as the income generated helps to change and improve things in my area • Payment for a service is no different to paying any other account • Its not important to pay for services because it is not catering for my needs • It is necessary to pay but I feel resentful about paying These statements were strongly agreed to by Neutrals and less so by other segments The Neutrals were the second largest segment and have an equal gender split. They were mainly younger in the age group 18 – 29 years and had some high school education. They understand the need to pay for services given that the income generated could help to improve or change things in the area where they live. However, they claimed that the services rendered were not catering for their needs
Defining statements for attitudinal segments- Begrudging Payers • I only pay because I am forced to do so • It’s government’s responsibility to provide services free of charge • The quality of services rendered do not warrant a full fee • Most people are not paying for their services why should I These statements were strongly agreed to by Begrudging Payers and less so by other segments The Begrudging Payers segment was the smallest of the three segments and comprised mainly females in the age group 30 – 39 years. These are resident in both formal and informal dwellings and have primary school qualifications. The respondents in this segment were self centred and have an air of entitlement.
Importance and satisfaction with specific services - basic services- ranked in order of importance [where 1 = very important] of where money should be spent first and the level of satisfaction with each Satisfaction levels are relatively high. Even higher were provision of clean water 89% and collection of refuse 81%. The provision of clean water and electricity were the two most important services
Basic Services Looking at the three groups and their satisfaction levels with basic services: • The Willing Payers group are the most receptive and positive towards services provided. The Begrudging Payers are the least positive.
Importance and satisfaction with specific services - basic services - ranked in order of importance [where 1 = very important] of where money should be spent first and the level of satisfaction with each
Importance and satisfaction with specific services - community services- ranked in order of importance [where 1 = very important] of where money should be spent first and the level of satisfaction with each
Community services • As with basic services, community services have higher satisfaction scores among the Willing Payers. However on comparing the Begrudging against the Neutral Payers, the former seem to be more satisfied than the latter • Most of the community services rank low in terms of importance • Provision of clinics was ranked highest in this batch
Importance and satisfaction with specific services -community services
Importance and satisfaction with specific services - regulated services- ranked in order of importance [where 1 = very important] of where money should be spent first and the level of satisfaction with each All regulated services are ranked important but have the lowest satisfaction scores overall.
Importance and satisfaction with specific services -regulated services
Serious problems facing the household / community – Top 5 mentioned Household • Unemployment 39% • Housing -structural 17% • Poverty/hunger 16% • Crime 13% • Illness 13% Community • Crime 70% • Lack of service 10% • Unemployment 8% • Poverty 7% • Illness 5% Problems are fragmented, varying from unemployment to leaking roofs etc. Crime is the biggest problem facing the community
During the past year - what has happened to the crime situation? Regardless of dwelling the popular view was that crime in the past year had worsened
Have you been a victim of any of the following violent crimes in the past year?
Have you been a victim of any of the following property crimes in the past year?
How safe do you feel walking in the area where you live during the day? Overall 60% generally feel unsafe during the day
How safe do you feel walking in the area where you live after dark? Over 90% of people feeling unsafe after dark
Where do you feel unsafe? Specific streets mentioned were Mandela, Holomisa and Ruth First
Agreement with….re last dealings you had with council Willing Payers believe more strongly that they are treated professionally and courteously by council – are ‘good’ payers treated differently to perceived ‘bad’ payers?
Agreement with….re last dealings you had with council The most agreeable to the statement were the Willing Payers
Statement best describing your knowledge of the Council Overall respondents claim to know little or nothing about the council with 58% of the Begrudging Payers claiming to know nothing about council
Satisfaction with the overall performance of the council in providing services to residents 55% of the sample indicated some satisfaction with the overall performance of the council The bulk of those positive were the Willing Payers
Over the last 4-5 years would you say that the council has improved its service delivery in your area? Overall 59% of the sample claimed that improvements in service delivery was evident whilst 16% said that it had deteriorated. The bulk of those seeing the improvements were in the Willing Payers segment. A third of the Begrudging Payers were negatively disposed towards service delivery
Which of the following do you pay for regularly? Services paid for regularly (50%+) were electricity, water, school fees, and clothing accounts. Looking at the different segments, the Willing Payers pay all services regularly except the television licence (32%).
Which of the following do you pay for regularly? People in formal dwellings pay their accounts more regularly than those in informal dwellings
Major expenses in household – open ended spontaneous mentions Groceries, lighting and accounts are the major expenses facing the households. Interestingly enough among the Willing Payers, the expenses were more evenly spread when compared to the neutrals and Begrudging Payers
Major expenses in household – open ended spontaneous mentions