Download
1 / 18
180 likes | 199 Vues
Early Childhood Transition: Facts, Figures, Fantasies and the Future. Objectives To share selected findings based on the SPP/APR and NECTC study To hear state experiences To identify resources and assistance To enable participant discussion. Session Presenters. Kathy Whaley, NECTAC

E N D
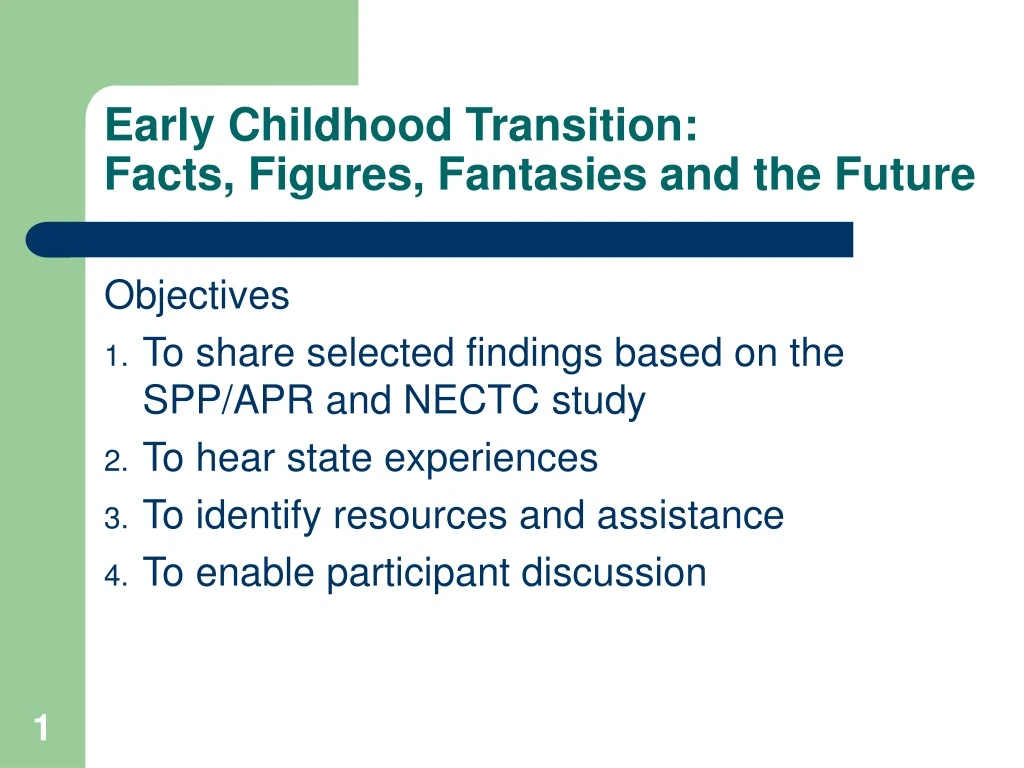
Early Childhood Transition: Facts, Figures, Fantasies and the Future Objectives • To share selected findings based on the SPP/APR and NECTC study • To hear state experiences • To identify resources and assistance • To enable participant discussion
Session Presenters • Kathy Whaley, NECTAC • Beth Rous, NECTC • Phyllis Mondak, Section 619, VA • Ron Dughman, MPRRC on behalf of NM • Karen Mikkelsen, NERRC
Indicator C8: Early Childhood Transition Summary of 06-07 APR
C8: Early Childhood Transition • Percent of all children exiting Part C who received timely transition planning to support the child’s transition to preschool and other appropriate community services by their third birthday including: • (A) IFSPs with transition steps and services • (B) Notification to LEA, if child potentially eligible for Part B; and • (C) Transition conference, if child potentially eligible for Part B.
Overall Trends Across Sub indicators • More states report higher rates of compliance in notifying LEAs of potentially eligible children (8B) and documenting transition steps within the IFSP (8A) than for holding transition conferences (8C) • More states report full compliance regarding Notification to LEA (8B)and report substantial compliance. • All states reported data on all sub indicators.
Progress • IFSP Steps (8A) – 30 states made progress (8 maintained 100%) • Notification (8B) – 22 states made progress (8 maintained 100%) • Conference (8C)– 32 states made progress (4 maintained 100%)
Slippage • IFSPs with Transition Steps/Services (N=11) • Notification to LEA (N=13) • Transition Conference (N=17) Reasons given: • Inaccurate or changing data systems/sources • Issues of data entry and reporting • IFSPs needed elements and instructions for documenting transition • Unclear policies • Staff shortages
Themes • Improving data collection, record keeping, data analysis and data sharing • Clarifying policies and aligning the consistency of policies across C and 619 • Improving communication and collaboration across Part C and 619 • Training and TA linked to monitoring and correction of non-compliance. • Collaborative and joint training efforts with Part B, Section 619
Indicator B12: Early Childhood Transition Summary of 06-07 APR
B12: Early Childhood Transition Percent of children referred by Part C prior to age 3 and who are found eligible for Part B, and who have an IEP developed and implemented by their third birthday.
Overall Trends Across Indicator • States show steady progress by national average of reported data (from baseline 72% to FFY 06-07 84%) • Changes to data systems decreased performance for some states but considered more accurate
Progress and Slippage • 37 states reported progress • 11 states reported slippage • 3 states maintained 100%
Progress Attributed To: • Changes in Data Collection Procedures and Systems • Changes in Monitoring Processes and Linkage to Improved Data Capacity • Improved Collaboration with Part C • Clearer Policies and Guidance • Intensive Targeted TA
Slippage Attributed to: • FFY 05-06 Data considered inflated or incomplete for purposes of analysis • Selection of monitoring sites in cycle • Staffing and personnel issues
Themes • Better data! • Better monitoring of compliance requirements • MOUs and improved collaboration with Part C • Clarified policies and guidance • Collaborative training and TA • Inconsistencies across states in policies regarding reasons for delay
Additional Resources National Early Childhood Transition Initiativehttp://www.nectac.org/topics/transition/ectransitionta.aspNational Early Childhood Transition Centerhttp://www.ihdi.uky.edu/nectc/NECTAC Resource Collection on Transition from Part C to Preschoolhttp://www.nectac.org/topics/transition/transition.aspSPP/APR Calendar: Technical Assistance Related to SPP Indicators and Determinationshttp://spp-apr-calendar.rrfcnetwork.org/techassistance.html