Statistical Metadata in the Data Reference Model
This presentation discusses the importance of statistical metadata in data architecture and statistics, providing mappings and specific examples. It explores the challenges of different metadata models and proposes a metamodel to capture relationships for data interoperability and composite applications.

Statistical Metadata in the Data Reference Model
E N D
Presentation Transcript
Statistical Metadata in the Data Reference Model National Infrastructure for Community Statistics (NICS) November 2, 2005, Community of Practice Meeting Metadata and NICS: Joys, Sorrows, and Payoffs Panel: Approaches to Meeting Statistical Metadata Needs Brand Niemann, U.S. EPA and SICoP Chair October 10, 2005 DRAFT
Overview • 1. Metadata in Data Architecture • 2. Metadata in Statistics • 3. Mappings and Specific Examples • 4. Some Next Steps
1. Metadata in Data Architecture • Metadata is data about data, but both need to be mapped to a higher level of abstraction and generalization to be useful in data interoperability and composite applications. • Different Communities of Interest/Practice use different metadata models leading to collisions between their data communities (e.g., see next slide). • Fall Federal Metadata Summit, The Federal Information and Records Managers’ (FIRM) Council in Partnership with the XML Community of Practice and CENDI, November 2, 2005! • The solution is a metamodel that captures the relationships and associations between the levels of abstraction and allows navigation and searches across all of them (e.g., see slide 5).
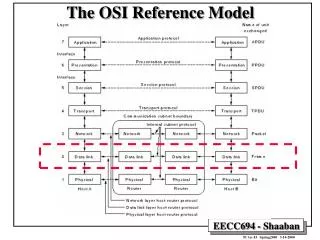
1. Metadata in Data Architecture Michael C. Daconta, The FEA Data Reference Model Status Update: After the Storm(ing)…, September 19, 2005, Enterprise Architecture Conference Keynote.
1. Metadata in Data Architecture Relationships and associations • Metamodel: Precise definitions of constructs and rules needed for abstraction, generalization, and semantic models. • Model: Relationships between the data and its metadata. • Metadata: Data about the data. • Data: Facts or figures from which conclusions can be inferred. Source: Professor Andreas Tolk, August 16, 2005 See slides 6-7 for definitions.
1. Metadata in Data Architecture • Metamodels: • Definition: Precise definitions of constructs and rules needed for abstraction, generalization, and semantic models (c.f., Professor Andreas Tolk). • Purpose: Avoid double work - enable reuse and encodes the relationships and enables applications of the data, metadata, and models (c.f., Professor Andres Tolk). • Model: • Definition: Relationships between the data and its metadata (c.f., W3C Resource Description Framework). • Purpose: Encodes the relationships and enables applications of the data and metadata (c.f., W3C Resource Description Framework).
1. Metadata in Data Architecture • Metadata: • Definition: Data about the data (standard). • Purpose: To provide an initial layer of abstraction and generalization of the data (standard). • Data: • Definition: Structured (relational databases), Semi-structured (mixed content with text and tables), and Unstructured (Web pages) (c.f., Data Reference Model). • Purpose: Facts or figures from which conclusions can be inferred (dictionary).
2. Metadata in Statistics • My Terminology: • 1. Documentation: • Many examples on the Web and in documents. • 2. Metadata: • Cindy Taeuber and Laura Smith, Statistical Metadata Components and Tools. • 3. Data Stories: • Cindy Taeuber, Labor Force and Housing Vacancy. • In process for Section 3. • Professor Dan Carr, George Mason University. • See my class project on the Web. • Proposed Indicators for the 2006 Report on the Environment. • See Section 3. • Annual Statistical Abstract of the United States. • See Section 3.
3. Mappings and Specific Examples Data Architecture Metamodels Models Metadata Data Documentation Metadata Data Stories Statistical Metadata
3. Mappings and Specific Examples • Proposed Indicators for the 2006 Report on the Environment: • Documentation: 88 PDF files on the Web. • Metadata and Data Stories: • Introduction • What the Data Show • Indicator Limitations • Data Sources • References • Graphics • R.O.E. Indicator QA/QC • Question/Response Model
3. Mappings and Specific Examples • Proposed Indicators for the 2006 Report on the Environment (continued): • Metadata and Data Stories (continued): • Question/Response: • T1Q1: Are the physical, chemical, or biological measurements upon which this indicator is based widely accepted as scientifically and technically valid? • T1Q2: Is the sampling design and/or monitoring plan used to collect the data over time and space based on sound scientific principles? • Etc. for a total of 14!
3. Mappings and Specific Examples This Data Architecture Provides the Three S’s: Structure, Searchability, and Semantics. Metamodel Model Metadata Figures Data Data Stories
3. Mappings and Specific Examples • Annual Statistical Abstract of the United States: • Documentation: About 40 PDF files on the Web and about 1500 Excel data tables on a CD-ROM. • Metadata: Five standard elements for each table (Title, Head Note, Content, Footnotes, and Source). • Data Stories: Some brief ones in the chapter text usually associated with key figures and tables.
3. Mappings and Specific Examples • Annual Statistical Abstract of the United States (continued): • Metadata and Data Stories (continued): • Section 1. Population (Tables 1 - 82) • Fig. 1.1. Percent Population Change: April 2000 to July 2002 • Fig. 1.2. Center of Population: 1970 to 2000 • Fig. 1.3. Foreign Born by Region of Birth: 2002 • Fig. 1.4. Population With School Education or More by Nativity and World Region of Birth: 2002 • Immigration (Table 5) • Estimates by age, sex, race and Hispanic origin (Table 11) • States, metro. areas, cities (Table 17) • Profiles of elderly, racial, and Hispanic-origin populations (Table 37) • Native and foreign-born populations (Table 48) • Ancestry, languages (Table 55) • Marital status and households (Table 61) • Religion (Table 81) • Etc. for total of 31 Sections! Model
3. Mappings and Specific Examples This Data Architecture Provides the Three S’s: Structure, Searchability, and Semantics. Metamodel Model Data Stories Metadata Figures Data
3. Mappings and Specific Examples Separation of the Data Presentation from the Data & Metadata. Data & Metadata Data Presentation/ Visualization http://web-services.gov/statabs2003no1.htm
3. Mappings and Specific Examples NICS Pilot Project Metamodel Across National to Local Data Examples (6)! This provides the basis for doing the relationships and associations in Slide 5!
3. Mappings and Specific Examples • NICS Learning Phase Workshop: Federal Organizations, January 6, 2005: • Semantic Interoperability Community of Practice Enablement (SCOPE) for NICS: • The infrastructure will be a network on the Web, but what kind of network will the NICS Community of Practice build?: • Links to models of knowledge representation in a semantically interoperable syntax (XML, RDF, & OWL): • An initial ontology for knowledge representation of indicators is provided as a use case for the NICS to support the Key National Indicators Initiative (KNII). See next slide and http://web-services.gov/NICS01062005.ppt
3. Mappings and Specific Examples NICS Use Case for the Key National Indicators Initiative (KNII). Ontology Metadata Content Note: The folder names are either the ontology or the knowledgebase instances.
3. Mappings and Specific Examples http://web-services.gov/pilots/DigitalHarbor/CampaignFinance.htm
4. Some Next Steps • NICS could: • (1) Just focus on “Statistical Metadata” for its own CoP. • (2) Also be a best practice use case for the Data Reference Model of “Statistical Metadata” for the Data Reference Model Architecture. • (3) SICoP could play a service role in converting NICS “Statistical Metadata” to Semantic Technology and Web formats for item (2) as shown here.
4. Some Next Steps FEA Reference Models and Profiles: PRM BRM SRM TRM Security & Privacy Records Management Geospatial Other: E-Gov Section 207 (d) Communities of Interest: IC MWG NIEM GEOINT NICS NARA State of Pennsylvania ISO 11179/XMDR, UBL, UDEF, etc. Etc. Phase 1: Taxonomy/Ontology Phase 2: Metadata Interoperability Phase 3: Executable Data Interoperability Semantic Interoperability DRM Core Semantic Interoperability Recent Use Case Example.
4. Some Next Steps Possible Model and Metamodel for the NICS Metadata Program Comment: One type of metadata may not fit all four boxes and so a model is needed to harmonize across them and a metamodel is needed to integrate across them. Also see “The Transition from Learning to Implementation: Some Thoughts, April 20, 2005 at http://web-services.gov/nics04202005.ppt
4. Some Next Steps • European Commission IDABC* Content Interoperability Strategy (http://europa.eu.int/idabc/servlets/Doc?id=22108): • The second category is that of projects, which requested a pan-European standard terminology, and reference system that did not yet exist. Projects such as FADN and CARE have devoted important efforts to build an agreement within their constituency on a set of precise definitions of the objects that they handle. • FADN is typical of projects led by statisticians who define both a classification system with a precise companion terminology, and a method for collecting data and for consolidating this data into a descriptive model composed from a set of complementary and meaningful statistics. It is worth pointing that EUROSTAT has accumulated a highly valuable experience through a large number of similar projects that required the integration (by alignment or by mapping on a pivot classification) of classification systems used by national administrations from the different Member States. • See http://europa.eu.int/idabc/en/document/2083/565 * Interoperable Delivery of European eGovernment Services to public Administrations, Business and Citizens.
4. Some Next Steps • The DRM Implementation Through Iteration and Testing Strategy includes five key activities over the next year: • Education and Training in DRM Version 2.0 and use in FEA – DRM-based Information Sharing Pilots (started June 13th). • Testing of XML Schemas and OWL Ontologies by NIST and the National Center for Ontological Research, respectively, among others (beginning after October 27th). • Inventory/Repository of Semantic Interoperability Assets and Development of a Common Semantic Model (COSMO) by the new Ontology and Taxonomy Coordinating Work Group (ONTACWG) (started October 5th). • Continued early implementation of DRM 2.0 concepts and artifacts by industry in “open collaboration with open standards” pilot projects and workshops (started July 19th). • Fostering champions of DRM Best Practices to improve (1) agency data architectures within agencies and (2) cross-agency data sharing across agencies in funded projects (in process).