Download
1 / 31
310 likes | 337 Vues
Explore how to use markers to find diseases, measure allelic association, linkage disequilibrium, and haplotype diversity. Learn about HapMap initiative, SNP genotyping, and haplotype tagging for medical genetics research.

E N D
A coalescent computational platform for tagging marker selection for clinical studies Gabor T. Marth Department of Biology, Boston College marth@bc.edu
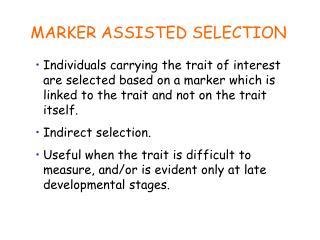
Allelic association • allelic association is the non-random assortment between alleles i.e. it measures how well knowledge of the allele state at one site permits prediction at another functional site marker site • significant allelic association between a marker and a functional site permits localization (mapping) even without having the functional site in our collection • by necessity, the strength of allelic association is measured between markers • there are pair-wise and multi-locus measures of association
D=f( ) – f( ) x f( ) Linkage disequilibrium • LD measures the deviation from random assortment of the alleles at a pair of polymorphic sites • other measures of LD are derived from D, by e.g. normalizing according to allele frequencies (r2)
strong association: most chromosomes carry one of a few common haplotypes – reduced haplotype diversity Haplotype diversity • the most useful multi-marker measures of associations are related to haplotype diversity n markers 2n possible haplotypes random assortment of alleles at different sites
Haplotype blocks Daly et al. Nature Genetics 2001 • experimental evidence for reduced haplotype diversity (mainly in European samples)
if the block structure is a general feature of human variation structure, whole-genome association studies will be possible at a reduced genotyping cost • this motivated the HapMap project Gibbs et al. Nature 2003 The promise for medical genetics • within blocks a small number of SNPs are sufficient to distinguish the few common haplotypes significant marker reduction is possible CACTACCGA CACGACTAT TTGGCGTAT
The HapMap initiative • goal: to map out human allele and association structure of at the kilobase scale • deliverables: a set of physical and informational reagents
SNPs: computational candidates where both alleles were seen in multiple chromosomes • genotypes: high-accuracy assays from various platforms; fast public data release HapMap physical reagents • reference samples: 4 world populations, ~100 independent chromosomes from each
LD-based multi-marker block definitions requiring strong pair-wise LD between all pairs in block Haplotype annotations – LD based Wall & Pritchard Nature Rev Gen 2003 • Pair-wise LD-plots
Dynamic programming approach Zhang et al. AJHG 2001 1. meet block definition based on common haplotype requirements 2. within each block, determine the number of SNPs that distinguishes common haplotypes (htSNPs) 3 3 3 3. minimize the total number of htSNPs over complete region including all blocks Annotations – haplotype blocks
Haplotype tagging SNPs (htSNPs) Find groups of SNPs such that each possible pair is in strong LD (above threshold). Carlson AJHG 2005
1. Required marker density 2. How to quantify the strength of allelic association in genome region Yoruban samples 4. How general the answers are to these questions among different human populations 3. How to choose tagging SNPs Focal questions about the HapMap CEPH European samples
Samples from a single population? (random 60-chromosome subsets of 120 CEPH chromosomes from 60 independent individuals)
Markers selected based on the allele structure of the HapMap reference samples… … may not work well in another set of samples such as those used for a clinical study. Consequence for marker performance
2. Experimentally genotype additional sets of samples, and compare association structure across consecutive sets directly Sample-to-sample variability? 1. Understanding intrinsic properties of a given genome region, e.g. estimating local recombination rate from the HapMap data McVean et al. Science 2004 3. It would be a desirable alternative to generate such additional sets with computational means
1. select markers (tag SNPs) with standard methods 2. generate computational samples for this genome region 3. test the performance of markers across consecutive sets of computational samples Towards a marker selection tool
3. Use the second haplotype set induced by the same mutations as our computational samples. 2. Only accept the pair if the first set reproduces the observed haplotype structure of the HapMap reference samples. This enforces relevance to the observed genotype data in the specific region. Generating data-relevant haplotypes 1. Generate a pair of haplotype sets with Coalescent genealogies. This “models” that the two sets are “related” to each other by being drawn from a single population.
Generating computational samples M Problem: The efficiency of generating data-relevant genealogies (and therefore additional sample sets) with standard Coalescent tools is very low even for modest sample size (N) and number of markers (M). Despite serious efforts with various approaches (e.g. importance sampling) efficient generation of such genealogies is an unsolved problem. N We are developing a method to generate “approximative” M-marker haplotypes by composing consecutive, overlapping sets of data-relevant K-site haplotypes (for small K) Motivation from composite likelihood approaches to recombination rate estimation by Hudson, Clark, Wall, and others.
2. build M-site composites M-site haplotypes as composites of overlapping K-site haplotypes M 1. generate K-site sets
000 100 001 101 010 110 011 111 000 001 010 011 100 101 110 111 Piecing together K-site sets this should work to the degree to which the constraint at overlapping markers preserves long-range marker association
A composite haplotype is built from a complete path through the (M-K+1) K-sites. Building composite haplotypes
30 CEPH HapMap reference individuals (60 chr) a typical 3-site composite 3-site composite haplotypes Hinds et al. Science, 2005
“short-range” “long-range” 3-site composites: the “best case” 1. generate K-site sets
The purpose of the composite haplotypes sets … Variability across sets … is to model sample variance across consecutive data sets. But the variability across the composite haplotype sets is compounded by the inherent loss of long-range association when 3-sites are used.
4-site composite 4-site composite haplotypes
“Best-case” 4 site composites Composite of exact 4-site sub-haplotypes
Variability across 4-site composites … is comparable to the variability across data sets.
1. select markers (tag SNPs) with standard methods 2. generate computational samples for this genome region 3. test the performance of markers across consecutive sets of computational samples Towards a marker selection tool