Download
1 / 17
190 likes | 520 Vues
Explore the marine fisheries management process, habitats, and resources for sustainable fishing practices. Learn about trophic levels, biomass pyramids, and the role of humans in the oceanic food chain.

E N D
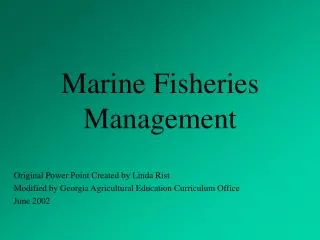
Marine Fisheries Management an introduction
Bangladesh: land of rivers and water. Some 710 rivers and tributaries.
The Bay of Bengal • The Bay of Bengal is conneted to the rivers. • 710 kim coastline. • Vast marine resources. • Fish spp: 475 • Shrimp spp: 36
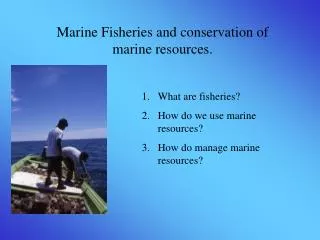
Marine Fisheries Overview
What is a marine fishery? • The resource (i.e., fishery stocks) • The habitat • The people involved
A Fishery • A fishery is composed of three elements – the resource (e.g., swordfish, squid, halibut) = “fishery stocks,” the habitat and the people who are involved in the capture, processing and sale of the resource. Modern fisheries management focuses on: • 1. regulation and conservation of the harvested resource • 2. protection of the habitat associated with the resource
Most fish are harvested within 200 miles of shore • Upwellings • Continental shelves • Estuaries
Most fish are harvested within 200 miles of shore • Although oceans cover about 70% of the Earth’s surface, they are not uniformly populated with fish. The most productive areas are closely associated with continental land masses where about 90% of commercial harvest occurs. This is due to both the accessibility of these areas to boats from land and their high productivity. Water in these areas is sufficiently shallow to allow light penetration and support large populations of phytoplankton – the base of marine food webs. Specific areas include: • Upwellings – rising currents in water column carrying nutrient-rich water to surface (e.g., off Vancouver Island, Canada, note resulting phytoplankton bloom). Also, off the western coast of South America where the Humboldt Current creates an upwelling.
Continental shelves – relatively shallow (200 m and less), highly productive ocean regions (e.g., historical fishing grounds off New England such as Georges Bank, Nantucket Shoals and Brown’s Bank). • Estuaries – areas of salt and fresh water mixing where streams empty into oceans; important nursery areas for many commercially important fish species and the most productive areas for marine invertebrates such as shrimp, clams and oysters. • Open ocean areas are generally less productive; however, fisheries that target large migratory species such as tunas and swordfish often fish these areas. These species are highly adapted for swimming long distances in pursuit of schools of small fish.
Aquatic food chain and trophic levels • Most fish that are harvested occur in mid- and upper trophic levels (secondary and tertiary consumers) in food webs; therefore, their production is dependent upon the amount of biomass that exists at lower trophic levels (producer and primary consumer). This illustrates the importance of phytoplankton (“producers”) and zooplankton (“primary consumers”) to marine ecosystems and, in particular, to the production of harvestable fish. • Secondary consumers in marine ecosystems are represented by small fish such as sardines, herring and anchovies. • Tertiary consumers include typical table fish such as halibut, tuna, cod and snapper.
Oceanic Food Chain Human typically harvest at trophic leve 3 & 4
Human typically harvest at trophicleve 3 & 4 • Due to taste preferences, humans typically harvest at trophic levels 3 and 4. Marine food webs are complex and many fish species feed at more than one trophic level. Thus, most individual fish species have trophic designations that are not whole numbers - e.g., snapper (4.6), cod (3.5), herring (3.1), sardine (2.5). An understanding of trophic levels in marine ecosystems is required to understand the change in trophic levels that may occur in response to fishing effort (discussed later).
A Biomass Pyramid • A biomass pyramid illustrates the relative amount of living material at each trophic level. Due to the inherent energetic inefficiencies of living systems, progressively less biomass is available at each trophic level. In most ecosystems, only about 10% of the biomass at any one trophic level is converted into biomass at the next highest trophic level. Decisions about which trophic level we choose to harvest has an important impact on the ability of a fishery to provide a reliable food supply in a sustainable manner. • To illustrate – approximately 3 million tons of the three major tropical tuna species are harvested each year. These tuna consume approximately 60 million tons of fish (e.g., sardines, anchovies) at the next lowest trophic level. Despite a general human preference for tuna over anchovies and sardines, clearly more biomass is available for harvest at these lower trophic levels.