Download
1 / 42
420 likes | 526 Vues
ATLANTIC STATES MARINE FISHERIES COMMISSION. Our Fishery Management Plan for American Eel. ASMFC’s interest in Eel due to decline in abundance. Recently, various indicators of abundance show a decrease (1980s to 1990s)

E N D
ATLANTIC STATES MARINE FISHERIES COMMISSION Our Fishery Management Plan for American Eel
ASMFC’s interest in Eel due to decline in abundance • Recently, various indicators of abundance show a decrease (1980s to 1990s) • Historically eel were very abundant - possibly providing 25 to 50% of total fish biomass in coastal streams (Smith and Saunders 1955; Ogden 1970)
Process through which a species is considered for management by the ASMFC • Interjurisdictional species found in the Atlantic coastal area • Significant decrease in abundance • Decrease in average age and size • Calculated mortality rate high • Economic concerns
Process for FMP • States identify their interest - Management Board formed • Technical Committee established • Plan Development Team formed • Draft plan written, reviewed/input by • public hearings • resource experts • habitat managers • law enforcement • Draft plan out for public hearings
Summary of Resource Concern • Stock abundance recently decreasing • States identifying economic losses • Concern expressed at Public Hearings that habitat impairments need to be identified
OUTCOME - DRAFT FMP • Through its preparation we learned that stock assessment • fishery dependent data are weak • fishery independent data also weak • Habitat quantity has been restricted • Habitat quality was degraded but is improving
Generic “mission” statement for most governmental agencies Provide for healthy, diverse, and productive fish community(ies) based self-sustaining native populations, occupying historic ranges, fulfilling their ecosystem functions, and allowing for a sustainable harvest.
External Problems and Challenges • Improved team approach with “partners” • Shared understanding of the issues • Shared goals and objectives • Standardization of data • Data sharing (not selling) in a timely fashion
An Exciting Time for Resource Management • Ecosystem approach has strong science support • New tools allow better data collection and data management (GPS, GIS) • All agencies are being moved towards the ecosystem approach
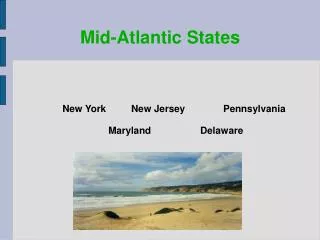
Eel have a unique life history • Catadromous - therefore up and down stream passage is important • Panmictic - therefore dealing with one population throughout its range • Range from Labrador to Panama, however, main concentration in Mid-Atlantic region
The following habitat data were compiled for FWS by W.D.N.Busch, S.J. Lary, and C.M. Castiglione (1998) • USEPA - 1:100,000 hydrology database for entire east coast (Reach Files Version 3 (rf3-alpha). • USACOE - National Inventory of Dams Database(1995-96 CD). • USGS - Daily streamflow for the entire east coast.
Assumptionsin addressing eel habitat • Glass eel (elvers) inhabit tidal salt, mixed and freshwaters (Tesch 1977) • Yellow eel (juvenile) inhabit rivers and impoundments (Hardy 1978; Fahay 1978) • Silver eel (maturing adults/adults) inhabit rivers and impoundments until sexually mature for return to the ocean (Wenner 1973; Facey and Van Den Avyle 1987)
Historic or Potential Habitats Region Stream LengthEstuary Area (km) Fresh Mixed Seawater (km2) South Atlantic 2460081839 15092 4371 Mid Atlantic 1993141211 18620 12340 North Atlantic 11148255 174 7625 Great Lakes/St. Law. 39934ND ND ND TOTAL 5967383105 33886 24336
Assumptionsfor this preliminary attempt to quantify habitat lost to eel • Upstream - dams restrict or prevent eel movement • Locks for navigation do not provide complete access • Downstream survival is also critical
The Watersheds with Dams Est. Avg. Annual water flow = 44,000 cfs
The Watersheds showing historic eel access and current, unrestricted access
North Atlantic Region: HUC# Descriptive Name Historic Current % lost # dams 101 St. John River 11335 1 99 37 102 Penobscot R. basin 15245 207 99 75 103 Kenebec R. basin 9186 208 98 97 104 Androscoggin R. basin 4467 195 96 95 105 Maine Coastal Area 10884 5166 53 98 106 Saco Area 9414 1685 82 212 107 Merrimack R. basin 11006 10 99 533 108 Connecticut R. basin 20874 99 99 941 109 Mass.-Rode Isl. Area 7886 1589 80 708 110 Connecticut Area 10335 1188 89 713 111 St. Francois River 849 1 99 13
The Watersheds with Dams Est. Avg. Annual water flow = 23,000 cfs
The Watersheds showing historic eel access and current, unrestricted access
Mid Atlantic Region HUC# Descriptive Name Historic Current % lost # dams 201 Richelieu L.Champl. 9126 1 99 235 202 Upper Hudson 22389 1 99 660 203 Lower Hudson 7781 1431 82 519 204 Delaware C. Area 26934 5148 81 1068 205 Susquehanna basin 52331 251 99 684 206 Upper Chesapeake 14884 8862 40 157 207 Potomac R. basin 28140 3281 88 443 208 Lower Chesapeake 199314 24533 88 884
The Watersheds with Dams Est. Annual Avg. water flow = 44,000 cfs
The Watersheds showing historic eel access and current, unrestricted access
South Atlantic Region HUC# Descriptive Name Historic Current % lost # dams 301 Chowan-Roanoke D. 36775 3632 90 371 302 Neuse-Pamlico D. 23324 12452 47 445 303 Cape Fear C. Drain. 20471 5990 71 626 304 Pee Dee Coastal D. 35880 6139 83 1034 305 Edisto-Santee C.D. 41504 7003 83 1942 306 Ogeechee-Savannah 34604 4508 87 1028 307 Altamaha-St. Marys 37172 4673 87 1353 308 St. Johns Coastal D. 8234 6582 20 40 309 Southern Florida C.D. 8044 4893 39 105
The Watersheds with Dams Est. Avg. annual water flow = 300,000 cfs
Great Lakes/St. Lawrence Region HUC# Descriptive Name Historic Current % lost # dams 412 Niagara R/E. Erie 40 0 100 1 4 413 SW Lake Ontario 7,295 0 100 72 414 SE Lake Ontario 14,152 0 100 169 415 L.Ontario/St. Lawren. 18,447 0 100 233 1Lost due to dams on the St. Lawrence River
Summary of FindingsTypes and Numbers of Dams by Region Region <10 ft. 10-24 25+ HydroE. North Atlantic 448 2260 813 561 Mid Atlantic 475 2563 1603 217 South Atlantic 194 3993 2818 141 Great Lakes/St. Law. 64 238 153 181
Summary of Potential Habitat Loses(Worse Case Scenario) Region Stream Length (km) Per Cent North Atlantic 101,134 91 Mid Atlantic 174,781 88 South Atlantic 190,136 77 Great Lakes/St. Law. 39,934 100 TOTAL 466,051 78
Potential Habitat Loses(Worse Case Scenario) Region Stream Length Per Cent (km) Atlantic Coast (Total) 466,051 78 of 596,738
Downstream Issues Although many areas of eel life history are still not well documented, one fact is certain - recruitment requires parents.
Eel not only need upstream passage to reach habitat to grow and mature, but adults need safe downstream passage in order to reproduce.
ASMFC’s Management activities:1. Complete and approve FMP2. Implement fishery dependent and fishery independent assessment programs3. Update data on obstructions to up- and down-stream movements4. Update data on contaminants and effect on reproduction5. Make recommendations to minimize anthropogenic impacts6. As year-class strength data become available assess cause/effect and minimize “causes”