Download

1 / 25
972 likes | 4.64k Vues
Measuring of Health and Disease. Chavanant Sumanasrethakul MD., M.Sc. Department of Preventive and Social Medicine BMA Medical College and Vajira Hospital 13 Oct 2009. Morbidity and mortality measurements Risk, incidence, prevalence Rates, ratio, proportion Survival rate.

E N D
Measuring of Health and Disease ChavanantSumanasrethakul MD., M.Sc. Department of Preventive and Social Medicine BMA Medical College and Vajira Hospital 13 Oct 2009
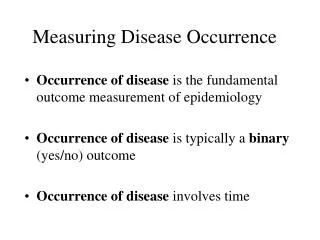
Morbidity and mortality measurements • Risk, incidence, prevalence • Rates, ratio, proportion • Survival rate
EPIDEMIOLOGY Scientific basis of public health Measure of mortality and morbidity Risk (Cumulative incidence) / Prevalence / Incidence Rates Ratio Proportion
Ratio is one number divided by another number (numerator doesn’t have to be included in denominator—and vice versa) • Proportion is a ratio in which the numerator is included in the denominator • It has no dimension because the unit of the numerator cancels out the unit of the denominator • Rate is a ratio • The numerator is the number of events • The unit is event (i.e., number of cases) • The denominator is the sum of follow-up time contributed by the people at risk of the event • The unit is time or, more accurately, person-time to account for duration of time of follow-up
Natural history of disease and some source of data Gordis 2004
Population at risk All women (age groups) Total population Population at risk 0-25 years 25-69 years 25-69 years Men Women 70+ years Eg. Population at risk in a study of carcinoma of cervix
Risk/Cumulative incidence (ความเสี่ยง) No. of new cases Risk = Proportion No. of people at risk At the beginning of the period
Prevalence (ความชุก) No. of cases with disease Prevalence = Rate Total population
Incidence (อุบัติการณ์) No. of new cases Incidence = Person-year (∑person-time at risk) Persons-time at risk Synonyms: person-time rate incidence density force of morbidity force of mortality in reference to deaths hazard rate disease intensity
Total observation time in health Modified from Beaglehole 1993
Incidence-Prevalence Relationship
Rates 3 main types • Crude rate • Specific rate • Standardized (adjusted) rate “Rates are central to epidemiology”
Cancer of the lung and pleura age-specific mortality rates per 100000 person–years vs. median year of death
Cancer of the lung and pleura age-specific mortality rates per 100000 person–years vs. median year of birth
Standardization “A set of techniques used to remove as much as possible the effects of differences in age or otherconfounding variables when comparing two or more populations. The most common method uses weighted averaging of rates specific for age, sex or other variables, according to some specific distribution of these variables.” Last, Dictionary of Epidemiology, 2001
Mortality of stroke cases in town A,B and general population
Standardized mortality ratio (SMR) • Estimating probability of dying if observed population same as expected (standard) • Expressed as ratio of observed/expected deaths • SMR > 100: more death than expected • SMR < 100: less deaths than expected
Survival rate • Probability of remaining alive for a specific length of time for or a chronic disease such as cancer • 1-year survival and 5-year survival rates are often used as indicators of the severity of disease and the prognosis
Survival curve for patients diagnosed with any type of leukemia 1-year survival 68% Median survival time 50% 5-year survival 47% Raymond 2004
Summarize • Measurement in epidemiological study • What are included? • Main ideas and concepts • Calculation / Understanding ?