Understanding Sequential Clinical Trials: Design, Implementation, and Analysis
210 likes | 311 Vues
Explore the design, purpose, and decision-making process of sequential clinical trials comparing treatments, measuring preference, and evaluating outcomes using sequential charting and analysis.

Understanding Sequential Clinical Trials: Design, Implementation, and Analysis
E N D
Presentation Transcript
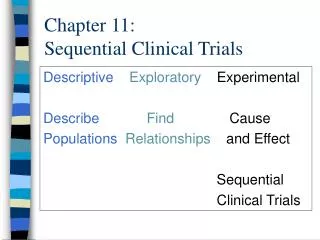
Chapter 11:Sequential Clinical Trials Descriptive ExploratoryExperimental Describe Find Cause PopulationsRelationships and Effect Sequential Clinical Trials
Sequential Clinical Trials Experimental designs – • Relative efficacy of different treatments (cause and effect) • Problems: 1. Fixed sample size prior 2. All data must be collected prior to analysis
The Design of a Sequential Trial • Purpose- • To compare two treatments: • New Treatment (experimental)- A • Old Treatment (standard)- B • Null hypothesis A = B • Explicit operational definitions, target population, and measurements are established
Between-Subject Comparison • First eligible patient admitted and is randomly assigned to either treatment A or B • Second eligible patient is admitted and is assigned to the alternate treatment • These two patients form a pair • Results of the pair are considered “little experiment”as we can determine for this pair whether A or B was better
Within- Subject Comparison • The comparison between A and B can be made on one subject when both treatments are presented to each subject • This approach is only appropriate when there are no carry over effects expected from one treatment to another • Usually, alternate pairs are given the treatments in reverse order, resulting in a crossover design • Crossover design reduces intersubject variability
Design- continued • The whole experiment is a sequence of these “little experiments”with each pair represents a comparison • The comparison between A and B can be measured in two ways: • Continuous variable- the magnitude of the difference • Nominal (discrete) variable- the preference measured by a subjective, yet, clearly defined criteria indicating that one treatment is more effective than the other
Sequential Chart • Results of each comparison within a pair of subjects are plotted on a sequential chart showing the cumulative results for all comparisons • After each successive “little experiment”is plotted the researcher stops to consider the results of all pairs completed so far and make one of the following three decisions:
Decision Making 1. Stop and reject Nullhypothesis making a terminal decision to recommend A or B 2. Stop and accept Nullhypothesis making a terminal decision that there is no difference between A or B 3. Continue to collect data because the cumulated data are not yet sufficient to draw a conclusion • The process of considering cumulative results after each pair is called“sequential analysis”
Measuring Preference • Preference is defined on the basis of clinically meaningful differences between two treatments • Specific criteria for preference of one treatment over the other can vary in objectivity Objective Criteria • Death Vs. Survival • Cured Vs. Not cured
Measuring Preference Subjective Criteria • Subjective evaluation of function • Patient’s general reaction to treatment Measuring Preference- Continuous Data Can be reduced to Nominal Data Treatment A preferred if it: Increases ROM at least 20 degrees more than Treatment B
Measuring Preference • Drawback: • Difference either 25 or 75 degrees is considered as difference • When the difference is based on Magnitude, the amount of difference is taken into account
Sequential Plans for Evaluating Preference • The decision to stop or continue a trail is based on “little experiments” Stopping Rules: • Upper boundary crossed (U), recommend A Terminal decision: Accept H1 : A>B
Sequential Plans for Evaluating Trials 2. Lower boundary crossed (L), recommend B Terminal decision: Accept H1 B>A 3. Middle boundary crossed (M), either above or bellow the origin, no preference Terminal Decision: Accept H0: A=B Figure 11-2
Effect Size • Preference is described according to the proportion in favor of Treatment A (the experimental treatment) • Under H0- this proportion is 50% for each treatment • Under Hr- this proportion is some value above 50% • If we set effect size at 0.80, we expect at least 80% of preferences to be for A before recommending Treatment A
Type I Error • The acceptable risk of recommending one treatment over the other when treatment A and B are not different • Type I Error rate is the probability of incorrectly rejecting the Null hypothesis (no difference), and accepting the Research hypothesis • The risk is symbolized by ά (alpha) and is set at .05
Type I Error • Alpha can designate: • a one-tailed test (ά1) directional research hypothesis or a two-tailed test (ά2) non directional research hypothesis
Type II Error • The probability of incorrectly accepting Null hypothesis (no difference), when rejecting research hypothesis (there is a difference between A and B), yet the analysis was not able to detect it. • This risk is symbolized by β (beta) and is set between 0.05 and 0.20
Power • The probability that a statistical test will be able to detect a true difference between A and B. • Power is equal to 1-β • If β= .05; power = .95 • This means that there will be 95% chance that an outer boundary will be correctly crossed • Figure 11-2, page 207, 208
Limitations of Sequential Designs • The analysis is limited to two treatments • No opportunity to explore multiple effects or interaction effects • No opportunity to control for extraneous variables • Treatment of ties • Conditional decision vs. terminal decision (based on boundary crossing)
Sequential Clinical Trials • Now you know all about sequential clinical trials!!!!