Download
1 / 11
110 likes | 177 Vues
Effects of Dam-Induced Daily River Stage Fluctuations on a Large Gravel Bar . Blair Stanley November 18, 2008. Outline. Introduction Objective Methods Progress to Date Preliminary Results and Conclusions To Do. Introduction. Dams alter hydrogeology

E N D
Effects of Dam-Induced Daily River Stage Fluctuations on a Large Gravel Bar Blair Stanley November 18, 2008
Outline • Introduction • Objective • Methods • Progress to Date • Preliminary Results and Conclusions • To Do
Introduction • Dams alter hydrogeology • Storage of water, sediment, and nutrients • Ecosystems (biogeochemistry) • Contaminants (dilution or intensification) • Change Channel hydraulics
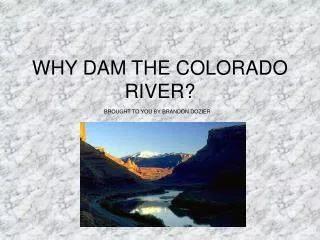
Introduction: Study Site • Hornsby Bend Island • Colorado River southeast of Austin, Texas • Large gravel bar with riparian forest • Severely modified hydrograph
Objective • How have dams affected the discharge within the Colorado River near Hornsby Bend Island? • How do regulated stage fluctuations affect flow patterns within Hornsby Bend Island? • Main Objective: • Analyze groundwater dynamics • Capture fluctuations in the water table • Couple groundwater and surface water data with ArcGIS
Methods • Monitor discharge values from the USGS • Monitor head distributions from probes on island • Locate piezometers using: • Differential Global Positioning System • Total Station Surveyor • Upload groundwater and surface water data to ArcGIS • Contour water table elevations using data interpolation http://www.nysgis.state.ny.us/outreach/gist/images07/base_1.jpg
Progress to Date • USGS data collected and uploaded • National Water Information System • Pressure-transducer data collected and being analyzed • Piezometer locations obtained and being uploaded
Progress to Date • Capitol Area Council of Governments • Orthoimagery downloaded and uploaded • Hydrography data downloaded and uploaded
Preliminary Results & Conclusions • Groundwater fluctuations mimic surface water fluctuations
To Do • Process water table elevation data with time • Upload data into ArcGIS • Create water table maps • Incorporate temperature data (if time permits)