Download
1 / 48
480 likes | 582 Vues
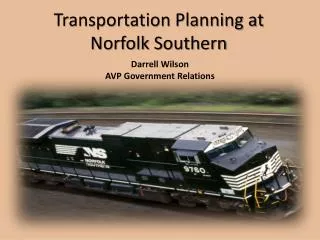
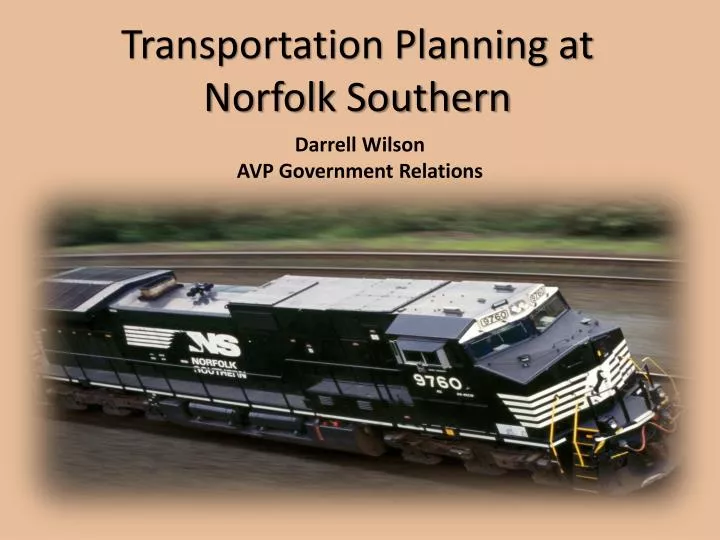
Transportation Planning at Norfolk Southern. Darrell Wilson AVP Government Relations. Railroads are a function of three essential things. Where do you go “market access”? How do you go-”geography-efficiency”? Why do you go “customers-revenues”?

E N D
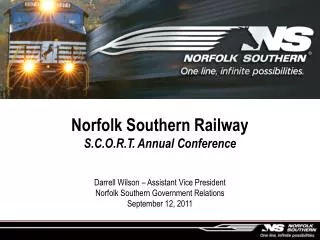
Transportation Planning at Norfolk Southern Darrell Wilson AVP Government Relations
Railroads are a function of three essential things • Where do you go “market access”? • How do you go-”geography-efficiency”? • Why do you go “customers-revenues”? • These three functions drive decision making on invested capital.
Important Factors when considering investment options • Railroads classify rail lines • Strategic feeder, Core, Super core etc • Investment strategies are organized around increasing density to lower costs • Having more can be less efficient • Operational efficiency before capacity
Important Factors when considering investment options • Customers dictate conveyance in many markets • Geography can be a limiting factor for rail access • Infrastructure/Capacity is usually approached incrementally • Operations, Routing, Power-Locomotives, O/D analysis, crews, market demand forecasts -drive investments decisions.
Infrastructure People RollingStock Locomotives The “Hierarchy” of Investment Risk
Managing Complex External Variables Customer Needs Competition from Other Modes Domestic Political Dynamics Cost of Service Environmental Awareness Operational/Infrastructural Capabilities Understanding Market Demand Maximization of Public Assets Economic Forces/Trends Domestic/Global Trade Demands Population Growth and Migration Speed, Safety, Security Numerous forces must be considered and balanced for the implementation of successful freight corridors
NS Engaged in Over $1.8 Billion in Network improvements Targeting Intermodal • Meridian Speedway: $300mm • Complete 2010 • Heartland Corridor: $282mm • Complete 2010* • Patriot Corridor: $140mm • Complete 2010 • Crescent Corridor Ph 1: $1.1b • Completion 2012 * Ex WV, VA terminals and CFE
The Heartland Corridor the nation’s first multi-state intermodal rail public-private partnership Inaugural double-stack train exiting Cowan Tunnel near Radford, Virginia September 9, 2010 Three year engineering effort Raise vertical clearances in 28 tunnels Removed 24 overhead obstructions The nation’s first multi-state intermodal rail corridor public-private partnership between the FHWA’s Eastern Federal Lands Highway Division, USDOT, Virginia, West Virginia, Ohio, and Norfolk Southern Tunnel work began Oct 2007; Sept 2010 New double-stack route eliminates over 200 miles of travel and approximately 24 hours of travel time between the East Coast and Chicago
Tonnage on Highways, RRs, and Inland Waterways: 2007 ASSOCIATION OF AMERICAN RAILROADS
Avg. Daily Long-Haul Truck Traffic on Nat’l Highway System: 2007 ASSOCIATION OF AMERICAN RAILROADS
Avg. Daily Long-Haul Truck Traffic on Nat’l Highway System: 2040 ASSOCIATION OF AMERICAN RAILROADS
Peak Period Congestion on the National Highway System: 2040 ASSOCIATION OF AMERICAN RAILROADS
It’s Not Realistic to Think Highway Construction Will Keep Up Highway vehicle-miles traveled (VMT) Highway lane-miles Source: FHWA ASSOCIATION OF AMERICAN RAILROADS
Annual Highway Capital Investments Needs In billions of 2006 dollars System Rehabilitation System Expansion System Enhancement Source: U.S DOT Status of the Nation’s Highways, Bridges and Transit Conditions and Performance Report, 2008
National Highway Funding Source: FDOT
U.S. Freight Railroad Capital Spending $ in Billions Despite the Recession, Capital Spending Staying High Source: AAR data, (Class I Railroads). Spending estimated for 2011 & 2012.
Population Growth Alone Will Mean Much Higher Rail Traffic ASSOCIATION OF AMERICAN RAILROADS
Long-Term Demand for Freight Transportation Will Surge Billions of Tons of Freight Transported in the U.S. The U.S. DOT expects total U.S. freight movements to rise from around 18.3 billion tons in 2010 to 27.1 billion tons in 2040 – a 50% increase. Up 50% Estimated: 18.3 bil U.S. DOT projection: 27.5 bil Source: FHWA - Freight Analysis Framework, version 3.2 ASSOCIATION OF AMERICAN RAILROADS
Sharp Increase in Rail Traffic Density Thousands of Car-Miles Per Mile of Road Owned Data are for Class I railroads. Source: AAR ASSOCIATION OF AMERICAN RAILROADS
Network of Key Corridors and Port Access River Port (8) Detroit Erie Sea Port (16) Chicago Ashtabula NY/NJ Cleveland Philadelphia Lake Port (7) Burns Harbor Toledo Pittsburgh Camden Naples Wilmington Portsmouth Baltimore Cincinnati Jeffersonville Norfolk Granite City Portsmouth Louisville Memphis Morehead City Charleston Savannah Brunswick St. Bernard Jacksonville New Orleans Mobile Braithwaite
NS’ Intermodal Network Norfolk Southern System Intermodal Terminal(s) Market Expansions thru 2010 Market Expansions thru 2012 IM Port Terminal TCS Terminals
Port of NY/NJ, Nfk/NN, Charleston, Savannah average container LOH
Record Reinvestments in Recent Years Despite the Economy Class I RR Spending on Infrastructure and Equipment Per Mile of Railroad* *Capital spending plus maintenance expenses minus depreciation. Source: AAR ASSOCIATION OF AMERICAN RAILROADS
Sharp Increase in Rail Traffic Density Thousands of Car-Miles Per Mile of Road Owned Data are for Class I railroads. Source: AAR ASSOCIATION OF AMERICAN RAILROADS
Working Together: Public-Private Partnerships Combine resources to meet public needs. Railroads pay for their benefits, public pays for public benefits. Examples: Alameda Corridor, CREATE, Heartland Corridor, National Gateway ASSOCIATION OF AMERICAN RAILROADS
Expansion Capital and Public Partnerships: • Most often at the top of the hierarchy of investment • Most likely not feasible if privately funded • Long lead time • Higher Risk/Moderate Private Return • Lower Public Risk/Moderate Public Return • Stranded Societal benefits at their core • Often involves cross-jurisdictional boundaries—very complex
Economic Forces to Consider: Freight Flows Transit time (in days) of ship traveling from Shanghai shown in BLUE circle, with land transit times between major cities appearing in BROWN
Market Analysis: Population Migration Population shift from 2000 to 2010, shown as percentage *Green indicates growth, Pink indicates loss
Market Analysis: Surface Freight Volumes Dry vanloads of domestic freight only Filtered by zip code of origin or destination of shipment in NS footprint Single driver transports only Domestic freight Average trip approximately 1,100 miles
Crescent Corridor at Full Build? in 2020? 350,000 Units Annually ; 1.3 Million Units Annually Crescent Corridor
Warehouse Square Footage Density by Zip Code-Memphis SF Density 37501: 885,000 38017: 674,800 38053: 873,289 38103: 240,400 38106: 1,405,154 38107: 289,243 38108: 709,973 38109: 825,693 38111: 550,499 38114: 2,071,316 38115: 4,368,110 38116: 2,183,409 38117: 400,000 38118: 43,729,895 38122: 202,940 38125: 812,697 38126: 120,000 38127: 300,378 38131: 147,695 38133: 1,604,793 38134: 1,848,049 38141: 15,526,560 38654: 8,745,464 38671: 11,486,286 38672: 2,108,499 72301: 1,052,075 72303: 0 72303 38103 36
Warehouse Square Footage Constructed Since 2002 by Zip Code SF Since 2002 37501: 885,000 38017: 0 38053: 0 38103: 0 38106: 0 38107: 0 38108: 0 38109: 0 38111: 0 38114: 0 38115: 0 38116: 0 38117: 0 38118: 3,679,111 38122: 0 38125: 0 38126: 0 38127: 0 38131: 0 38133: 0 38134: 0 38141: 1,041,622 38654: 1,900,464 38671: 8,382,110 38672: 2,108,499 72301: 800,000 72303: 0 72303 38103 37
External Variable: Market Analysis and Potential Public BenefitCurrent Lengths of Haul on Long-Distance Trucks 4% of all hauls are over 500 miles in length Hauls over 500 miles represent 20% of total vehicle miles traveled
External Variable – Market AnalysisKey Origin/Destination Pairs in the Freight Transportation Market Meridian Speedway Corridor Heartland Corridor Crescent Corridor
CRESCENT CORRIDOR INTERMODAL FACILITIES2012 AND BEYOND – INVESTMENT SUBSETS MOVING FORWARD Open 2012 Open 2013 Charlotte, NC • Birmingham, AL; Memphis, TN; Greencastle, PA; and Harrisburg, PA Open 2014 and Beyond • Atlanta, Knoxville, E-Rail, Roanoke, Philadelphia, and Bethlehem Open 2012 Open 2013 Open 2014 and Beyond
Memphis Harrisburg – 30 hours Memphis Philadelphia – 43.3 hours E. Tennessee New Jersey – 30 hours Transit Times Must be Truck Competitive Targeted Schedules
Speed Improvement Study Status Study & O-of-M Estimates Completed Review Complete - Estimates Being Finalized Under Review To Be Evaluated Lines Not Under Study Riverton Norfolk Southern Crescent Corridor and Parallel Interstate Highways
Capacity Improvement Status Completed – OofM Costs Determined Hi-Rail/Site Inspection Completed Estimate Being Progressed To Be Evaluated No Improvements Planned Riverton Norfolk Southern Crescent Corridor and Parallel Interstate Highways
Crescent Corridor Financial Investment Hierarchy 2010 INTERMODAL TERMINALS 2011 2012 2013 SPEED ENHANCEMENTS 2014 2015 2016 ADDED CAPACITY ROLLING STOCK The Future
Today’s Profits Pay For Tomorrow’s Railroads Today’s earnings pay for tomorrow’s railroads. Take away earnings and you take away investments. RR Spending Per Mile Net Income Source: AAR ASSOCIATION OF AMERICAN RAILROADS
If ROI < cost of capital: • Lower capital spending • Weaker physical plant, equipment • Slower, less reliable service • Disinvestment Return on Investment is Crucial If ROI >cost of capital: • Capital spending expands • Stronger physical plant; more and better equipment. • Faster, more reliable service • Sustainability ROI ASSOCIATION OF AMERICAN RAILROADS