Analyzing 20th Century Climate Variability: A C20C Model Intercomparison Initiative
This initiative aims to conduct a comprehensive intercomparison of climate model simulations focusing on key components influencing 20th-century climate variability. We propose the title "Reproducing Climate of the Past 100 Years" for our paper. Key time series, including global temperature anomalies, Southern Oscillation metrics, and Indian Monsoon rainfall, will be analyzed. By comparing model outputs with observational data, we seek to assess model performance and improve predictive capabilities. The discussion will explore methodologies, including high and low-frequency component analysis and correlation with sea surface temperatures.


Analyzing 20th Century Climate Variability: A C20C Model Intercomparison Initiative
E N D
Presentation Transcript
Model Intercomparison Discussion Fred Kucharski (Abdus Salam ICTP, Trieste, Italy) and Adam Scaife (MetOffice, Exeter, UK) as discussion leader
General: We have the plan to write a C20C model intercomparison paper. Time series of several important components of the climate variability of the 20th century should be compared and analyzed here. Proposed working title: A suitable title might be something like "Reproducing climate of the past 100 years". Another question is: "How can we use C20C type simulations to test models against observations?" This is a very under exploited but important area.
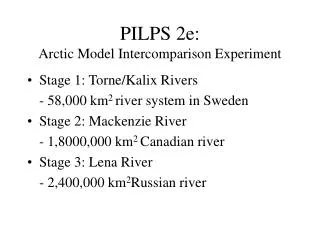
A. What time series did we collect (from HadISST forced runs?!): 1. Annual global 2m land surface air temperature anomalies Area average of all land surface grid boxes. Weight the anomalies from 1961-90 in each grid box with the cosine of latitude before averaging. 2. Southern Oscillation Tahiti and Darwin (or nearest grid point) monthly mean surface pressure from the model. 3. North Atlantic Oscillation Iceland and Azores (or nearest grid point) monthly mean surface pressure values from the models. 4. Sahel rainfall As near as possible to 12.5N-17.5N, 15W-37.5E, June-September means in mm of total rainfall averaged after weighting with the cosine of latitude of each grid box. 5. Indian Monsoon Rainfall As near as possible to 10N-30N, 70E-95E, June-September mean rain over land points, averaged after weighting with the cosine of latitude of each grid box. Some Results………
Example 5: Indian Monsoon rainfall Area average JJAS precip 70E to 95E, 10N to 30N, over land points only Data so far from: METF, UKMO, NASA, MGO-Russia, UMCP,ICTP Interannual: CC(CRU,c20c_multim_ensm) = 0.27 Best: 0.44 Worst: 0.04 Decadal (11-year running mean filter): CC(CRU, c20c_multim_ensm) = 0.80 Best: 0.82 Worst: 0.56 We know that results may improve Considerably in pacemaker experiments
Regression of Decadal IMR against SST CRU C20C Multi model Ensemble mean As can be seen, on Decadal time scale anticorr between ENSO and IMR is reproduced. But as well Indian Ocean seem to play a role
B. what else 6. PNA index (e.g. 500 hPa height, [(15-25N, 180-140 W)- (40-50N, 180-140W) +(45-60N, 125W-105W)-(25-35N, 90-70W)] 7. more series..... C. Should we collect and compare fields as well? If yes which (e.g. eofs of North Atlantic 500 hPa height, etc)? D. What about the pace maker experiments? Would be interesting to collect time series as well from there? Results from Indian rain suggest that they improve considerable the performance of the hindcasts.
E. What kind of analysis Suggestions: 1. Compare time series with observations. 2. Distinguish as well high frequency from low frequency components. 4. Compare standard deviations, etc with observations. 5. Where possible assess potential predictability and compare with actual predictability. 6. Regress against SSTs to identify potential forcings. 7. Taylor Diagrams (= potential + actual predictability + amplitudes) F. Anything else?