Electron Cloud Measurements at Fermilab's Main Injector: Insights and Future Directions
This document presents findings from Bob Zwaska's presentation on electron cloud measurements at Fermilab's Main Injector, discussed at the ECloud07 Workshop. The Main Injector operates with a high-power 120 GeV proton beam, catering to antiproton and neutrino production with significant upgrades planned to enhance proton intensity. Key issues addressed include dynamic pressure rise during cycles and the impact of bunch intensity on electron cloud formation. The report also outlines ongoing simulation studies and future measurement improvements aimed at optimizing performance and understanding instability phenomena.

Electron Cloud Measurements at Fermilab's Main Injector: Insights and Future Directions
E N D
Presentation Transcript
Electron Cloud Measurements at the Fermilab Main Injector Bob ZwaskaFermilabECloud07 WorkshopApril 9, 2007
The Main Injector Program • Provides high power, 120 GeV proton beam • 80 kW for antiproton production • 180 kW for neutrino production • Takes 6 or 7 batches from the 8 GeV Booster @ 15 Hz • 4-5 × 10¹² protons per Booster batch • Total cycle time ≥ 1.4 s + batches/15 Booster NuMI (Double) Batch 1 (PBar) Batch 2 Batch 6 Main Injector Batch 3 Batch 5 Batch 4
53 MHz beam H=588 84-500 bunches 6-10 x 1010 protons/bunch Bunch length: 0.2-1.5 m Transverse size : 1-5 mm Ramps 8 – 120 GeV 0.8 s ramp period Passes through transition 3-D dampers needed for operation Resistive wall instability No evidence of e-p Linear growth rate scaling Operation limited by fractional loss Losses < 10% Maximum charge is secondary Main Injector Operation
Upgrade Plans at Fermilab • Medium term Proton Intensity upgrades • Intended for neutrino program (at first) • Proton Plan (in progress, done by ~ 2008) • Use slip stacking in Main Injector to increase proton bunch intensity • NOvA-ANU (planned for ~2011) • Increase cycling rate of MI by using Recycler for stacking • SNuMI (early planning) • Increase proton bunch intensity by using accumulator for stacking • HINS (Proton Driver, on hold) • Increase proton bunch intensity through new 8 GeV Linac
Evolution of Proton Intensities • Early plans were to go straight from Proton Plan to HINS • Start to get big bunch intensities, and worry about electron cloud • More recently, upgrade path has lengthened • First leg, using the Recycler, does not significantly increase bunch intensity • Other legs still involve some increase • Miguel Furman did initial simulations of the MI w/ Proton Driver • Instigated study program at Fermilab • More calculations from LBL (other talks)
First Simulation Input • Simulations suggested that MI might be near a threshold for electron cloud formation • 4-5 orders or magnitude increase of cloud density with a doubling of bunch intensity • Leads to a program of studies: • Try to find evidence of a cloud with present MI • Expand simulations • Look at secondary emission in the MI M. Furman (LBL) FERMILAB-PUB-05-258-AD
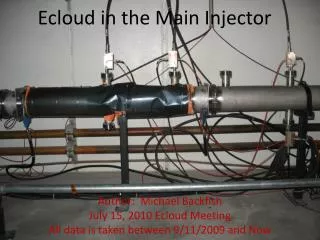
Dynamic Pressure Rise See fast rise over the course of a cycle (1s) The control system induces delay Occurs only at location of uncoated ceramic Beam Intensity Ion Pump Current Ceramic beam pipes
Dynamic Rises Around the Ring Rises observed at ~4% of pumps Locations of vacuum rises
0 84 168 252 336 420 504 588 Type of pump installed at two locations 50 Hz Pump • Higher bandwidth pump • Saw more structure • Pressure increases with injections • Increases and decreases during cycle 1.0 × 10¹¹ / bunch 0.5 × 10¹¹ / bunch
Electron Probe • Retarding Field Analyzer • Borrowed from Argonne • Installed in drift region • Have a lot of interference • Magnet bus (grounds) • RF & beam signals (RF noise) • Being used as an electron counter • Not biasing retarder • Filtered output current Collector Retarder
Cycle Measurement • DC signal seen to spike at middle of cycle • Around the time of transition • Rapid increase of signal occurs into acceleration • Dip occurs at transition • Maximum occurs shortly after transition • Electron count decreases toward the end of the cycle
Collected results • Large number of cycles sampled at maximum current • Clear turn-on at higher intensities • Noise is bad due to amplifier/MADC system • 0.2 uA ~ 1% neutralization • Expect new measurements with 11-batch structure • More high intensity bunches
Closer look at Transition • Cloud increases rapidly as size decreases • Decreases temporarily at minimum bunch length • Wasn’t expected, but repeatable
Another look at Transition • Better filtering/amplifying allow a closer look • Introduces time delay • Some cloud before transition • Biggest effect after • The dip definitely occurs • Bunch length dependence looks complicated • Naïve expectation was that shortest bunch length gave highest electron current • Perhaps due to electron energy or beam pipe geometry (Furman)
Secondary Emission Measurement • Measured at SLAC’s facility with actual MI beam pipe (Bob Kirby) • On average, 1.9-2 electrons produced per incident 400 eV electron on MI pipe • Difference is conditioning • SEY maximum is far beyond that used in simulation • POSINST needs more like 1.3-1.5 for reasonable simulation results
Future Measurements • Improve MI detector installation • Better shielded cables and grounds • Better electronics/DAQ • Real-time bunch-by-bunch tune measurement • Achieved by manipulating damper system • Running sums of beam oscillations • Well suited for FPGA • May see coherent shifts • Plan to install new detectors in Booster & RR • Enameled coatings for high resistivity electrodes • Fritz Caspers idea • Looking into getting MI pipe coated and installed
Summary • Measurements of electron cloud formation in MI • Vacuum pressure rise & Direct electron detection • Suggest few % neutralization • No Instabilities from electrons • Dip of electron current at transition • Perhaps due to SEY/geometry effects • Simulations suggest possibility of threshold • Somewhat consistent with observed turn-on • However, disconnect on SEY • Main Injector upgrades may push us past threshold • However, none of the approved upgrades do so • Planning to continue measurements • Test new, higher intensity beams • New instrumentation
Electron Cloud Measurements at the Fermilab Main Injector Bob ZwaskaFermilabECloud07 WorkshopApril 9, 2007