Download
1 / 15
160 likes | 415 Vues
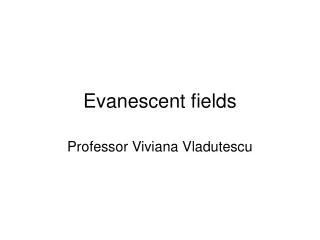
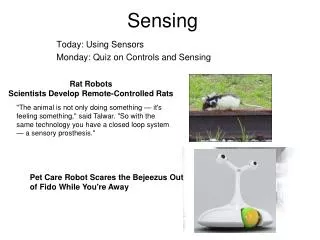
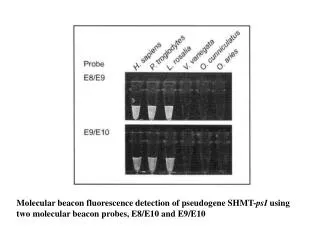
Molecular beacon fluorescence detection of pseudogene SHMT- psI using two molecular beacon probes, E8/E10 and E9/E10. Evanescent Wave Sensing. Detection of Phosphorylated STAT3 Protein by Fiber-Based Sensor. Fluorescence Generated at Surface. Exciting Laser. Cladding. Core.

E N D
Molecular beacon fluorescence detection of pseudogene SHMT-psI using two molecular beacon probes, E8/E10 and E9/E10
Detection of Phosphorylated STAT3 Protein by Fiber-Based Sensor Fluorescence Generated at Surface Exciting Laser Cladding Core Fluorophore labeled Phospho-STAT3 antibodies. Fluorescence coupled into fiber. Phospho-STAT3 Phospho-STAT3 antibodies (IgG) STAT - Signal Transducer and Activator of Transcription protein
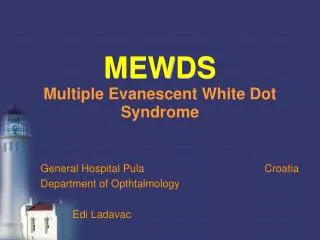
Surface Plasmon Sensors Kretschmann (ATR) geometry used to excite surface plasmons
Surface plasmon resonance curves. The left-hand side curve is for just the silver film (labeled Ag); the right-hand side shows the curve (labeled Ag/p-4-BCMU) shifted on the deposition of a monolayer Langmuir-Blodgett film of poly-4-BCMU on the silver film
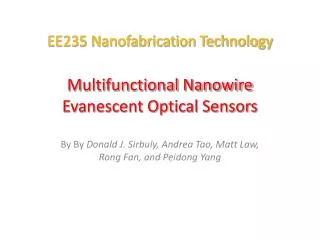
Photonic Crystal Sensors Close packing of colloidal nanospheres to form a photonic crystal of close-packed colloidal array. (Left) Atomic Force Microscope (AFM) image of the surface layer. (Right) Scanning Electron Microscope (SEM) image of a cross-section (Markowicz and Prasad; unpublished).
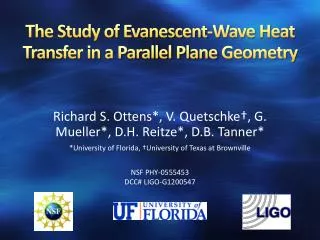
Visible extinction spectra showing how diffraction depends on the glucose concentration for a 125µm-thick PCCA glucose sensor. The ordinate is given as –log T, where T is the transmittance. The PCCA expands for concentrations between 0.1 and 0.5 mM glucose.
Schematics of a five parameter flow cytometer showing details of collection scheme.
Applications • HIV Monitoring • Leukemia or Lymphoma Immunophenotyping • Organ Transplant Monitoring • DNA Analysis for Tumor Ploidy and SPF • Primary and Secondary Immunodeficiency • Bacterial contamination in food and water
Biophotonics Opportunities • Modeling of light propagation in tissue • In-vivo Bioimaging, Spectroscopy, and Optical Biopsy • Real-Time monitoring of Drug Interactions • Optical Biopsy • Nano-Biophotonic Probes • Multiphoton Processes for Biotechnology • Femtolaser based biotechnology\ • Nanoarray multianalytic sensors • Multiparameter Molecular Flowcytometry • Single Molecule Biofunctions • Nanomedicine
Acknowledgements • Researchers at the Institute: • Prof. E. Bergey • Prof. A. Cartwright • Prof. M. Swihart • Prof. E. Furlani • Dr. A. Kachynski • Dr. A. Kuzmin • Dr. Y. Sahoo • Dr. H. Pudavar • Dr. T. Ohulchanskyy • Dr. D. Bharali • Dr. D. Lucey • Dr. K. Baba • Dr. J. Liu • Outside Collaborators • Prof. R.Boyd • Prof. J.Haus • Prof. J M J Frechet • Prof. M. Stachowiak • Dr. A. Oseroff • Dr. R. Pandey • Dr. J. Morgan • Dr. P Dandona • DURINT/AFSOR • Dr. Charles Lee
“Lighting the Way to Technology through Innovation” The Institute for Lasers, Photonics and Biophotonics University at Buffalo Biophotonics P.N.Prasad www.biophotonics.buffalo.edu