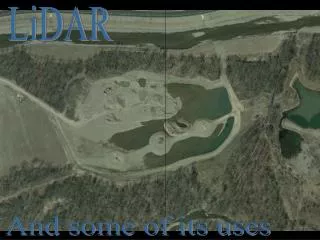
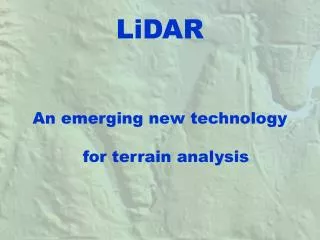
Visualizing lidar DEMs
This presentation, delivered at the Geological Society of America Annual Meeting in Portland, Oregon, focuses on visualizing Lidar Digital Elevation Models (DEMs) and their application in understanding the Skokomish River topography. Ralph Haugerud from the U.S. Geological Survey discusses shaded-relief images and the importance of considering various illumination angles to enhance geological features. Through examples, the presentation emphasizes analyzing multiple images to best illustrate relevant topographical elements, including slope, elevation, and subsidence patterns.

Visualizing lidar DEMs
E N D
Presentation Transcript
October 2009, Geological Society of America Annual Meeting, Portland, Oregon Visualizing lidar DEMs Ralph Haugerud U.S. Geological Survey c/o Earth & Space Sciences University of Washington Seattle, WA 98195 rhaugerud@usgs.gov / haugerud@u.washington.edu
B V S 2 km O Skokomish River Shaded-relief image of lidar topography, illumination from NW
B V S 2 km O Skokomish River Shaded-relief image of lidar topography, illumination from NE
B V S 2 km O Skokomish River Lidar topography, colored by slope
B V S 2 km O Skokomish River Lidar topography, darker where steeper, colored by elevation
100% value (brightness) 0 0 slope 100% Hillshade—no unique relation between slope and brightness
100% value (brightness) 0 0 slope 100% Vertical hillshade with exaggeration: value = hillshade(<zgrid>, 0, 90, shade, 6)
100% value (brightness) 0 0 slope 100% value = con(slope > 40, 0,~ 100 - int( 100*sqrt(slopedeg / 40.0))) 40 degrees
B V S O what is this? ~3 ft subsidence of diked area -2 ft NAVD88 previously-noted fault scarp +20 ft NAVD88
The moral of this story • Look at lots of images, not a default hillshade • Think about the images that might best illustrate the features that interest you. Then make them