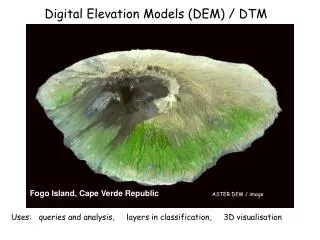
Digital Elevation Models (DEMs)
Analysis of Surface Textures of Physiographic Features Extracted from Digital Elevation Models via Grey Level Co-occurrence Matrix: A Multiscale Approach. Digital Elevation Models (DEMs). The Global Digital Elevation Model (GTOPO30) of Great Basin.

Digital Elevation Models (DEMs)
E N D
Presentation Transcript
Analysis of Surface Textures of Physiographic Features Extracted from Digital Elevation Models via Grey Level Co-occurrence Matrix: A Multiscale Approach
Digital Elevation Models (DEMs) The Global Digital Elevation Model (GTOPO30) of Great Basin • Location: latitude 38 15’ to 42 N, longitude 118 30’ to 115 30’ W • Grid size: 925 m • Elevation range: 1,005 – 3,651 m (rescaled to the interval of 0 to 255 - the brightest cell has the highest elevation)
Digital Elevation Models (DEMs) • One of the primaries issues in dealing with DEMs are uncertainties caused by: • Data errors: • Data capture errors: • Cloud or forest cover • Instable remote sensing equipment • Atmospheric refraction • Analysis and visualization errors: • Interpolation procedures • The limited horizontal and vertical resolution of terrain models • Scale • Spatial resolution • Spatial extent • Lack of standardisation • These factors lead to uncertainties in the extracted landforms and features
Generation of MultiscaleDEMs Multiscale DEMs generated using the lifting scheme, using scales of 1 to 20 Scale: 1 Scale: 3 Scale: 5 Scale: 10 Scale: 15 Scale: 20
Generation of MultiscaleDEMs Multiscale DEMs generated using the lifting scheme, using scales of 1 to 20 Scale: 3 Scale: 1 Scale: 5 Scale: 20 Scale: 15 Scale: 10
Physiographic Features Extracted from of the DEM • Segmentation of the terrain of the DEM of Great Basin into the predominant physiographic features; mountains, basins and piedmont slopes
Physiographic Features Extracted from of the DEM Mountains Basins Piedmont slopes
Physiographic Features Extracted from the Generated MultiscaleDEMs Mountains Scale: 1 Scale: 3 Scale: 5 Scale: 10 Scale: 15 Scale: 20
Physiographic Features Extracted from the Generated MultiscaleDEMs Basins Scale: 5 Scale: 3 Scale: 1 Scale: 20 Scale: 15 Scale: 10
Physiographic Features Extracted from the Generated Multiscale DEMs Piedmont slopes Scale: 5 Scale: 3 Scale: 1 Scale: 20 Scale: 15 Scale: 10
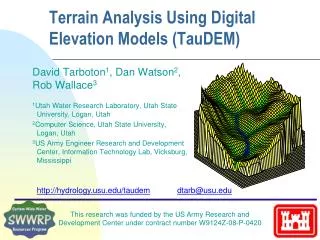
Multiscale Analysis • A number of studies have been conducted on classification of various landforms extracted from multiscale DEMs, including: • Physiographic features (mountain, basin & piedmont slope) • Morphometric features (plane, channel, ridge, pass, peak & pit) • Hydrological features (drainage networks & catchments) • Beach landforms (foreshors, beach & foredune) • Soil properties (anthrosols, flovisols, cambisols & podzols) • However, not much attention has been provided on the effect of multiscaling on surface textures.
Surface Texture • Texture refers to the spatial organisation of intensity values of blocks of contiguous cells on a surface. • It can be evaluated using perceptual descriptors such as smooth, rough or regular, or regular repetitions of elements or patterns. • A number of methods have been proposed for texture analysis, including • Laws’ texture energy • Markov random field • Fractal analysis • Gabor filtering • Wavelet transforms • Morphological filtering • Quadrature mirror filtering (QMF) • Grey level co-occurrence matrix (GLCM) is employed in this study as it is reported to have good performance in terms of spatial localisation
Objective • To analyse the surface textures of physiographic features extracted from multiscaleDEMsusing GLCM. • The analysis will be conducted using four GLCM parameters: • Contrast • Autocorrelation • Energy • Entropy Measurement of local variations Measurement of regularities of distribution of grey levels
Grey Level Co-Occurrence Matrix (GLCM) • A GLCM is a square matrix with the same size as the number grey levels in an image, which is generated by computing the frequency of occurrences of grey level pairs for cells separated by a fixed geometric displacement.
Generation of GLCM • Computation of co-occurrence features using the full range of cell elevation values could result in a GLCM with a large number of entries with low values. • This causes the computed texture parameters to be easily distorted by noise in the image. • Hence, it is preferable to transform the original grey level range into a smaller number of possible grey levels using either scalar or vector quantisation. • For extracting GLCM features in this study, the elevation ranges in the DEMs have been reduced from the original ranges to 32 using histogram transformation.
Generation of GLCM • In Cartesian coordinates, GLCM N(i, j) is computed for cell pairs separated by a vector displacement (∆x, ∆y): where (x, y) and (x + ∆x, y + ∆y) are the base and neighbour cells of the cell pair respectively, i and j are the grey levels of the base and neighbour cells respectively, and # denotes frequency. • In order to evaluate grey level variations over small areas, displacement size of 1 is used.
Generation of GLCM • Cell pairs at the following orientations are used: • Horizontal: 0 ° (∆x = 1, ∆y = 0) • Vertical: 90 ° (∆x = 0, ∆y = -1) • Diagonal: 45 ° (∆x = 1, ∆y = -1) 135 ° (∆x = -1, ∆y = -1)
GLCM Parameters Analysed • Contrast SC • Contrast is a measure of the amount of local variations present in an image. • An image with smooth surface texture, with low levels of local variation, produces a low value of contrast. • On the other hand, a high value of contrast implies that the image has a rough surface texture.
GLCM Parameters Analysed • Autocorrelation SR • Autocorrelation is a measure of grey level linear dependencies in the image. • A high value of correlation implies a linear relationship between the grey levels of cell pairs, and hence, a smooth surface texture.
GLCM Parameters Analysed • Energy SN • Energy provides a measure of repeated transitions of the cell pairs, which indicates textural uniformity. • High values of energy occur when the grey level distribution in the image has either a constant or periodic form, with the vector displacements often falling on the same (i, j) grey level pair.
GLCM Parameters Analysed • Entropy SE • Entropy is a measure of randomness of the image. • If the image is not texturally uniform, many elements in the GLCM will have low values and hence, the entropy will be large.
GLCM Parameters Analysed • The parameters vary based on surface profile: • Increasing roughness: • Increase of contrast and entropy • Decrease of autocorrelation and energy • Decreasing roughness: • Decrease of contrast and entropy • Increase of autocorrelation and energy
Results & Analysis • Contrast 0° 45° 90° 135°
Results & Analysis • Autocorrelation 0° 45° 90° 135°
Results & Analysis • Energy 0° 45° 90° 135°
Results & Analysis • Entropy 0° 45° 90° 135°
Results & Analysis • Varying patterns are observed in the plots due to varying surface profiles and the changes that occur over the scales. • The smoothing of the terrain during multiscaling causes the removal of curvature regions in the terrain. • The distribution of curvature regions in a terrain determines the roughness of the surface texture. • The removal of curvature regions from the terrain during multiscaling results in the multiscale DEMs and the corresponding features having increasing values of energy and entropy, and decreasing values of contrast and entropy, indicating decreasing roughness.
Results & Analysis • In general, mountains and basins have the highest and lowest distributions of curvature regions respectively. • Hence, it is observed that for all the scales, mountains have the highest roughness as compared to the other features, while basins have the lowest roughness. • For autocorrelation, the DEMs and mountains exhibit similar patterns at the initial scales, indicating that for terrains with rough surface profile, mountains are the more dominant of the three predominant physiographic features in deciphering terrain character. 0° 45°
Results & Analysis • For each parameter, similar trends are observed in the plots for the four different cell pair orientations, indicating similar trends of change of surface texture in the different orientations over the scales. • However, varying values are observed for the different orientations, depending on textural uniformity in the corresponding orientations. • The highest values of energy and entropy, and the lowest values of contrast and entropy are observed for the vertical orientation (90°), indicating that the textural features in this direction have the lowest roughness. • On the other hand, the lowest values of energy and entropy, and the highest values of contrast and entropy are observed for the diagonal orientations (45 and 135°), indicating that the textural features in these directions have the highest roughness.
Results & Analysis • Implementation on terrains with moderate and smooth surface profiles Great Plains Great Falls
Results & Analysis • Great Plains (Moderate surface profile) Contrast Autocorrelation Entropy Energy
Results & Analysis • Great Falls (Smooth surface profile) Contrast Autocorrelation Entropy Energy
Results & Analysis • The results obtained demonstrate that GLCM can be an appropriate tool for classifying landforms from multiscale DEMs based on the different texture characteristics of the landforms. • Surface texture has often used in conjunction with spectral data for image classification. • The use of texture implies that landforms in the DEM are not spatially homogenous, but rather the inhomogeneity of the landforms produce different texture characteristics. • Due to their reliance on spatial variation, texture methods are most appropriate under conditions of high local variance.
Conclusion • Varying patterns are observed in the plots of GLCM parameters due to varying surface profiles and the changes that occur over the scales. • Due to the smoothing of the terrain during multiscaling, the features have increasing values of energy and entropy, and decreasing values of contrast and entropy, indicating decreasing roughness. • Mountains have the highest roughness as compared to the other features over the scales, while basins have the lowest roughness. • For each parameter, similar trends are observed in the plots for the four different cell pair orientations, indicating similar trends of change of surface texture in the different orientations over the scales. • However, varying values are observed for the different orientations, depending on textural uniformity in the corresponding orientations. • The results obtained demonstrate that GLCM can be an appropriate tool for classifying landforms from multiscale DEMs based on the different texture characteristics of the landforms.