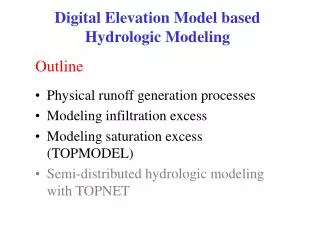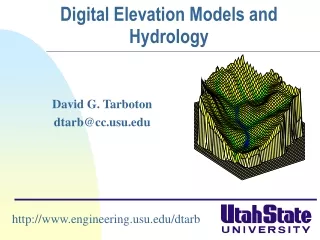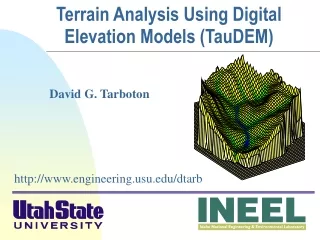
Grid-Based Modeling with Digital Elevation Models
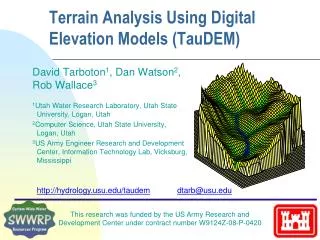
Grid-Based Modeling with Digital Elevation Models. David G Tarboton Utah State University http://www.engineering.usu.edu/dtarb/ david.tarboton@usu.edu (several slides from David Maidment). Outline. Grid data structures Surface flow models Channel network and watershed delineation.

Grid-Based Modeling with Digital Elevation Models
E N D
Presentation Transcript
Grid-Based Modeling with Digital Elevation Models David G Tarboton Utah State University http://www.engineering.usu.edu/dtarb/ david.tarboton@usu.edu (several slides from David Maidment)
Outline • Grid data structures • Surface flow models • Channel network and watershed delineation • Reading: • Modeling our world Chapter 9. • Arc Hydro Model Chapter 4 on Drainage Systems.
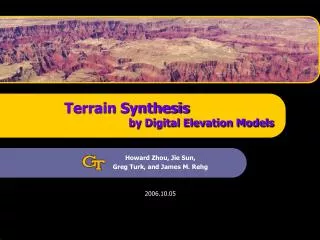
Numerical representation of a spatial surface Grid TIN Contour and flowline
A grid defines geographic space as a matrix of identically-sized square cells. Each cell holds a numeric value that measures a geographic attribute (like elevation) for that unit of space.
The grid data structure • Grid size is defined by extent, spacing and no data value information • Number of rows, number of column • Cell sizes (X and Y) • Top, left , bottom and right coordinates • Grid values • Real (floating decimal point) • Integer (may have associated attribute table)
Definition of a Grid Cell size Number of rows NODATA cell (X,Y) Number of Columns
Floating Point Grids Continuous data surfaces using floating point or decimal numbers
Value attribute table for categorical (integer) grid data Attributes of grid zones
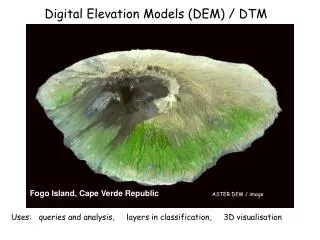
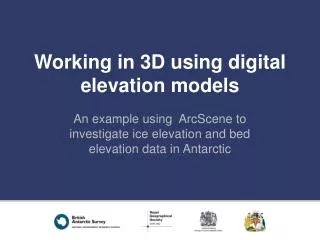
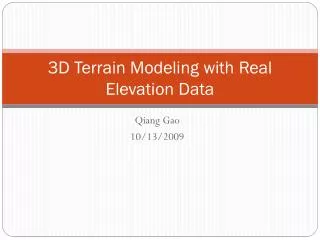
Spatial Surfaces used in Hydrology Elevation Surface — the ground surface elevation at each point
Topographic Slope • Defined or represented by one of the following • Surface derivative z • Vector with x and y components • Vector with magnitude (slope) and direction (aspect)
Drainage area (also called contributing area or flow accumulation) • Concentrated at a point • Dispersed - specific catchment area
Stream line Contour line Upslope contributing area a Specific catchment areaa is the upslope area per unit contour length [m2/m m]
Wetness indexa/S or ln(a/tan) a/S evaluated at each point in the terrain Of importance in topographically based modeling of runoff generation by saturation from below with TOPMODEL
Surface Flow Models • The Eight direction pour point model • The D vector surface flow model
A Case Study of Hog Pen Creek Hog Pen Ck 4 km 4 km
20 ft contour 100 ft contour Stream Center Line Drainage direction Watershed Delineation by Hand Digitizing Watershed divide Outlet
30 Meter MeshStandard for 1:24,000 Scale Maps and the National Elevation Dataset
720 720 Contours 740 720 700 680 740 720 700 680 Digital Elevation Model (DEM) Elevations
67 56 49 52 48 37 58 55 22 Direction of Steepest Descent 30 30 67 56 49 52 48 37 58 55 22 Slope:
32 64 128 16 1 8 4 2 Eight Direction Pour Point Model ESRI Direction encoding
4 3 2 5 1 6 7 8 Eight Direction Pour Point Model D8 Band/GRASS/TARDEM Direction encoding
1 1 1 1 1 1 1 1 1 1 1 4 3 3 1 4 3 1 1 3 1 1 2 1 1 12 1 2 1 12 1 1 1 2 16 1 1 2 1 16 2 1 3 6 25 3 6 1 2 25 Contributing Area Grid Drainage area threshold > 5 Cells
Filling in the Pits • DEM creation results in artificial pits in the landscape • A pit is a set of one or more cells which has no downstream cells around it • Unless these pits are filled they become sinks and isolate portions of the watershed • Pit filling is first thing done with a DEM
Watershed andDrainage PathsDelineated from 30m DEM Automated method is more consistent than hand delineation
1 1 2 1 2 3 5 3 3 5 4 4 4 4 4 6 6 6 Stream Segments in a Cell Network 5 5
Subwatersheds for Stream Segments Same Cell Value
? Topographic Slope Topographic Definition Drop/Distance Limitation imposed by 8 grid directions.
The D Vector Surface Flow Model Tarboton, D. G., (1997), "A New Method for the Determination of Flow Directions and Contributing Areas in Grid Digital Elevation Models," Water Resources Research, 33(2): 309-319.) (http://www.engineering.usu.edu/cee/faculty/dtarb/dinf.pdf)
Contributing Area using D Contributing Area using D8
DEM based delineation of channel networks and subwatersheds 500 cell theshold 1000 cell theshold
100 grid cell constant support area threshold stream delineation
200 grid cell constant support area based stream delineation
AREA 2 3 AREA 1 12 How to decide on drainage area threshold ?
Examples of differently textured topography Badlands in Death Valley.from Easterbrook, 1993, p 140. Coos Bay, Oregon Coast Range. from W. E. Dietrich
Canyon Creek, Trinity Alps, Northern California. Photo D K Hagans
Gently Sloping Convex Landscape From W. E. Dietrich
Same scale, 20 m contour interval Driftwood, PA Sunland, CA Topographic Texture and Drainage Density
Contrasting Interpretations “landscape dissection into distinct valleys is limited by a threshold of channelization that sets a finite scale to the landscape.” (Montgomery and Dietrich, 1992, Science, vol. 255 p. 826.) “any definition of a finite channel network is arbitrary, and entirely scale dependent.” (Band, 1993, in “Channel Network Hydrology”, edited by Beven and Kirkby, p15.)
Suggestion: One contributing area threshold does not fit all watersheds. Lets look at some geomorphology. • Horton’s Laws • Stream Drops
Hortons Laws: Strahler system for stream ordering 1 3 • most upstream is order 1 • when two streams of a order i join, a stream of order i+1 is created • when a stream of order i joins a stream of order i+1, stream order is unaltered 1 2 1 2 1 1 1 1 1 2 1 2 1 1 1 1 1 1