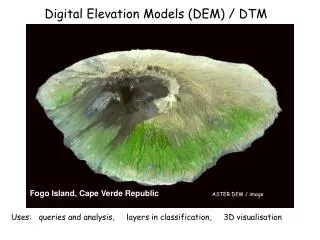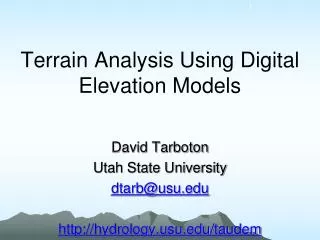
Digital Elevation Models And Relief Models
Learn about Digital Elevation Models (DEM) and how they represent terrain elevation data with grid points, intervals, and sources. Explore examples like Mt. Kilimanjaro and San Andreas Fault.


Digital Elevation Models And Relief Models
E N D
Presentation Transcript
Digital Elevation Models are: • Data files that contain the elevation of the terrain over a specified area, usually at a fixed grid interval • The intervals between each of the grid points will always be referenced to some geographical coordinate system. (e.g. latitude-longitude, UTM, SP). • The closer together the grid points are located, the more detailed the information will be in the file. The details of the peaks and valleys in the terrain will be better modeled with a small grid spacing than when the grid intervals are very large. Elevations other than at the specific grid point locations are not contained in the file. As a result peak points and valley points not coincident with the grid will not be recorded in the file. • The DEM file also does not contain civil information such as roads or buildings. It is not a scanned image of the paper map (graphic). It is not a bitmap. The DEM does not contain elevation contours, only the specific elevation values at specific grid point locations. (SEE NEXT SLIDE FOR EXAMPLE) source: http://www.softwright.com/dem.html DEM
67 56 49 46 50 53 44 37 38 48 58 55 22 31 24 61 47 21 16 19 53 34 12 11 12 Digital Elevation Model: What it looks like Lay a grid over some part of the world and find the average elevation in each cell DEM
67 56 49 46 50 53 44 37 38 48 58 55 22 31 24 61 47 21 16 19 53 34 12 11 12 Cell Definition cell size 50 (cell value) cell The size of a cell is in either: meters, feet, degrees, or arc seconds DEM
DEM Data Sources Primary Data Sources: • Shuttle Radar Topography Mission (SRTM) or other airborne sensors Secondary Sources from existing maps: • 30m DEMs from 1:24,000 scale map • 1” National Elevation Dataset • 3" (100m) DEMs from 1:250,000 scale maps • 30" DEM of the earth (GTOPO30) DEM
Shuttle Radar Topography Mission (SRTM) • 1 arc-second elevation data for the United States, 3 arc-second data for the globe • Produced by radar measurements from a Shuttle mission, Feb 11-22, 2000 • http://srtm.usgs.gov/data/obtainingdata.html DEM
Santa Barbara, California http://srtm.usgs.gov/srtmimagegallery/index.html DEM
San Andreas Fault, California DEM http://srtm.usgs.gov/srtmimagegallery/index.html
Salt Lake City, Utah http://srtm.usgs.gov/srtmimagegallery/index.html DEM
Mt Kilimanjaro, Tanzania http://srtm.usgs.gov/srtmimagegallery/index.html DEM
Interferometry used by SRTM In interferometry, two images are taken from different vantage points of the same area. The slight difference in the two images allows scientists to determine the height of the surface. DEM
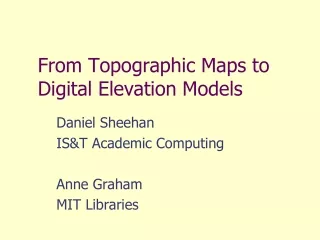
Secondary Data Source Generation:Using USGS Topographic Maps DEM
200 Meter Mesh (Universal Transverse Mercator Coordinates) 1km 1km DEM
100m 100 Meter Mesh (UTM Coordinates) 1km 100m 1km DEM
DEM Elevations 720 720 Contours 740 720 700 680 740 720 700 680 DEM
Comparison Cell Size 30m 100m DEM
30m DEMs • Best resolution standardized data source available for the US • Coverage of the country is incomplete • Data by 7.5’ map sheets in UTM projection • Link for UShttp://edcwww.cr.usgs.gov/Webglis/glisbin/guide.pl/glis/hyper/guide/usgs_dem DEM
Seamless 1” DEM for the US in 1° x 1° blocks Compiled by synthesizing the 30m DEM’s from 1:24,000 scale maps Link to website http://edcnts12.cr.usgs.gov/ned/ National Elevation Dataset DEM