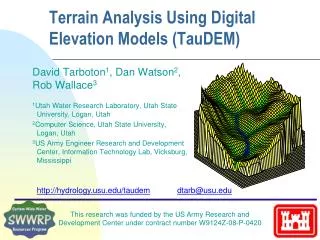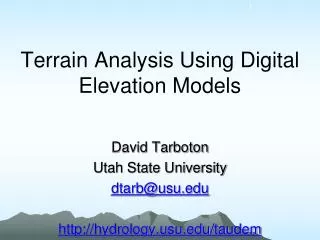
Terrain Analysis Using Digital Elevation Models (TauDEM) in Hydrology
380 likes | 464 Vues
Explore grid-based flow direction, accumulation, watershed delineation, special functions, and more using TauDEM for hydrological applications. Learn about channel networks, drainage area thresholds, and stream delineation techniques.

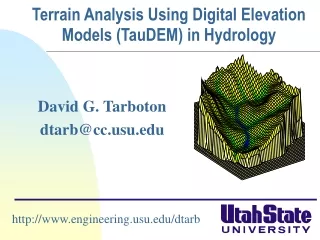
Terrain Analysis Using Digital Elevation Models (TauDEM) in Hydrology
E N D
Presentation Transcript
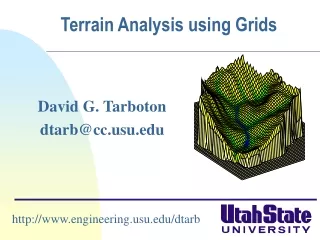
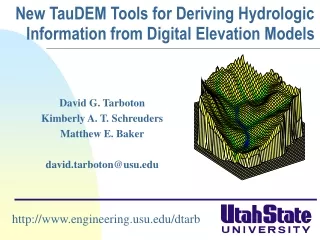
Terrain Analysis Using Digital Elevation Models (TauDEM) in Hydrology David G. Tarboton dtarb@cc.usu.edu http://www.engineering.usu.edu/dtarb
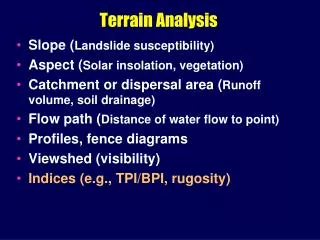
Overview • Review of digital elevation model grid based flow direction, accumulation and watershed delineation • Channel network delineation. Objective selection of channel delineation threshold and representation of variable drainage density. • Terrain flow fields and their numerical representation. Multiple flow direction approaches. • Specialized grid accumulation functions
Elevation Surface — the ground surface elevation at each point Digital Elevation Model — A digital representation of an elevation surface. Examples include a (square) digital elevation grid, triangular irregular network, set of digital line graph contours or random points.
Digital Elevation Model Based Flow Path Analysis Eight direction pour point model D8 Grid network 4 3 2 1 1 1 1 1 1 1 1 1 1 5 6 7 1 1 1 2 4 2 3 2 3 1 1 Grid Order 8 1 1 1 2 1 1 1 1 3 12 Drainage Area 1 1 1 1 1 1 2 1 16 3 2 1 1 1 3 2 2 6 25 3
100 grid cell constant support area threshold stream delineation
200 grid cell constant support area based stream delineation
AREA 2 3 AREA 1 12 How to decide on drainage area threshold ? Why is it important?
Hydrologic processes are different on hillslopes and in channels. It is important to recognize this and account for this in models. Drainage area can be concentrated or dispersed (specific catchment area) representing concentrated or dispersed flow. Objective determination of channel network drainage density
Delineation of Channel Networks and Subwatersheds 500 cell theshold 1000 cell theshold
Same scale, 20 m contour interval Driftwood, PA Sunland, CA Examples of differently textured topography
Gently Sloping Convex Landscape From W. E. Dietrich
“landscape dissection into distinct valleys is limited by a threshold of channelization that sets a finite scale to the landscape.” (Montgomery and Dietrich, 1992, Science, vol. 255 p. 826.) Suggestion:Map channel networks from the DEM at the finest resolution consistent with observed channel network geomorphology ‘laws’. One contributing area threshold does not fit all watersheds.
1 3 1 2 1 2 1 1 1 1 2 1 2 1 1 1 1 Constant Stream Drops Law based on Strahler Stream Ordering Broscoe, A. J., (1959), "Quantitative analysis of longitudinal stream profiles of small watersheds," Office of Naval Research, Project NR 389-042, Technical Report No. 18, Department of Geology, Columbia University, New York.
Nodes Links Single Stream Note that a “Strahler stream” comprises a sequence of links (reaches or segments) of the same order Stream DropElevation difference between ends of stream
200 grid cell constant support area based stream delineation
Local Curvature Computation(Peuker and Douglas, 1975, Comput. Graphics Image Proc. 4:375) 43 48 48 51 51 56 41 47 47 54 54 58
? Topographic Slope Topographic Definition Drop/Distance Limitation imposed by 8 grid directions.
The D Algorithm Tarboton, D. G., (1997), "A New Method for the Determination of Flow Directions and Contributing Areas in Grid Digital Elevation Models," Water Resources Research, 33(2): 309-319.) (http://www.engineering.usu.edu/cee/faculty/dtarb/dinf.pdf)
Contributing Area using D Contributing Area using D8
Useful for example to track where sediment or contaminant moves
Useful for example to track where a contaminant may come from
Useful for a tracking contaminant or compound subject to decay or attenuation
Useful for a tracking a contaminant released or partitioned to flow at a fixed threshold concentration
Transport limited accumulation Useful for modeling erosion and sediment delivery, the spatial dependence of sediment delivery ratio and contaminant that adheres to sediment
Reverse Accumulation Useful for destabilization sensitivity in landslide hazard assessment with Bob Pack
TauDEM Software Functionality • Pit removal (standard flooding approach) • Flow directions and slope • D8 (standard) • D (Tarboton, 1997, WRR 33(2):309) • Flat routing (Garbrecht and Martz, 1997, JOH 193:204) • Drainage area (D8 and D) • Network and watershed delineation • Support area threshold/channel maintenance coefficient (Standard) • Combined area-slope threshold (Montgomery and Dietrich, 1992, Science, 255:826) • Local curvature based (using Peuker and Douglas, 1975, Comput. Graphics Image Proc. 4:375) • Threshold/drainage density selection by stream drop analysis (Tarboton et al., 1991, Hyd. Proc. 5(1):81) • Other Functions: Downslope Influence, Upslope Dependence, Wetness index, distance to streams, Transport limited accumulation
TauDEM in ArcGIS Visual Basic ESRI ArcGIS 8.x Toolbar Visual Basic GUI application Standalone command line applications C++ COM DLL interface Available from TauDEM C++ library Fortran (legacy) components http://www.engineering.usu.edu/dtarb/ USU TMDLtoolkit modules (grid, shape, image, dbf, map, mapwin) ESRI gridio API (Spatial analyst) Vector shape files ASCII text grid Binary direct access grid ESRI binary grid Data formats
AREA 2 3 AREA 1 12 Are there any questions ? http://www.engineering.usu.edu/dtarb