Terrain Analysis using Grids
800 likes | 852 Vues
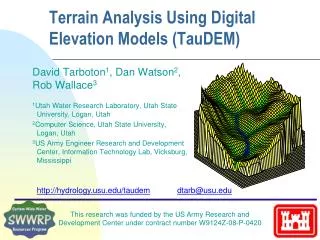
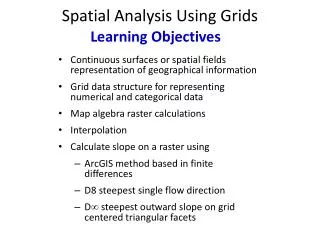
Terrain Analysis using Grids. David G. Tarboton dtarb@cc.usu.edu. http://www.engineering.usu.edu/dtarb. Overview. Complete Exercise 3 Spatial Analysis and Raster Calculations Runoff Generation Interpolation Geomorphology, Topographic Texture and Drainage Density

Terrain Analysis using Grids
E N D
Presentation Transcript
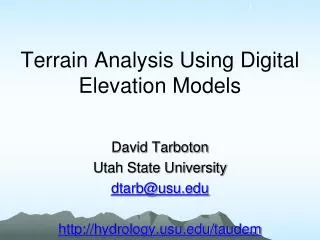
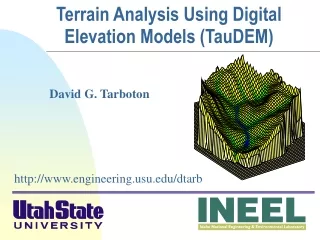
Terrain Analysis using Grids David G. Tarboton dtarb@cc.usu.edu http://www.engineering.usu.edu/dtarb
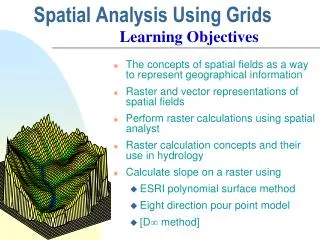
Overview • Complete Exercise 3 • Spatial Analysis and Raster Calculations • Runoff Generation • Interpolation • Geomorphology, Topographic Texture and Drainage Density • Objective Selection of Channelization threshold • TauDEM software
Reflections on Exercise 3 There is a lot of stuff going on when we execute the Arc Hydro terrain processing and watershed delineation tools. Lets think a little bit about what this means
Duality between Terrain and Drainage Network • Flowing water erodes landscape and carries away sediment • Topography defines drainage direction on the landscape • Threshold drainage area to define a stream: 4.5 km2 (20,000 15m DEM cells)
y f(x,y) x Grid used to represent a continuous surface field
67 56 49 52 48 37 58 55 22 Direction of Steepest Descent 30 30 67 56 49 52 48 37 58 55 22 Slope:
32 64 128 16 1 8 4 2 Eight Direction Pour Point Model
Contributing Area Grid 1 1 1 1 1 1 1 1 1 1 1 4 3 3 1 4 3 1 1 3 1 1 1 1 1 12 1 2 1 12 1 1 1 2 16 1 1 2 1 16 2 1 3 6 25 3 6 1 2 25 TauDEM convention includes the area of the grid cell itself.
1 1 1 1 1 1 4 3 3 1 1 2 1 1 12 1 1 1 2 16 2 1 3 6 25 Stream Definition Contributing Area > 10 Cell Threshold
1 1 2 1 2 3 5 3 3 5 4 4 4 4 4 6 6 6 Stream Segmentation 5 5 ArcHydro Page 74
Catchment Definition Same Cell Value
Catchments • For every stream segment, there is a corresponding catchment • Catchments are a tessellation of the landscape through a set of physical rules
Catchment GridID DEM GridCode 4 3 5 Vector Polygons Raster Zones Raster Zones and Vector Polygons One to one connection
Drainage Lines and Drainage Points DrainageLines are drawn through the centers of cells on the stream links. DrainagePoints are located at the centers of the outlet cells of the catchments ArcHydro Page 75
Area goes to Line Connectivity For each catchment there is a unique drainage line GridID is same on both Catchment and Drainage Line
Adjoint Catchments Adjoint catchment: the remaining upstream area draining to a catchment outlet. ArcHydro Page 77
Raster Calculator Cell by cell evaluation of mathematical functions
Example Precipitation - Losses (Evaporation, Infiltration) = Runoff 5 6 7 6 - 3 3 2 4 = 2 3 5 2
Cell based discharge mapping flow accumulation of generated runoff Radar Precipitation grid Soil and land use grid Runoff grid from raster calculator operations implementing runoff generation formula’s Accumulation of runoff within watersheds
Runoff generation at a point depends on • Rainfall intensity or amount • Antecedent conditions • Soils and vegetation • Depth to water table (topography) • Time scale of interest These vary spatially which suggests a spatial geographic approach to runoff estimation
Rainfall-Runoff Function for Texashttp://www.crwr.utexas.edu/gis/gishyd98/library/wbtexas/sect5.htm Po = 800mm/yr
Map-Based Surface Water Runoff Estimating the surface water yield by using a rainfall-runoff function Runoff, Q (mm/yr) Q P Runoff Coefficient C = Q/P Accumulated Runoff (cfs) Precipitation, P (mm/yr)
Modeling infiltration excess Empirical, e.g. SCS Curve Number method CN=100 80 90 70 60 50 40 30 20
Runoff generation processes P Infiltration excess overland flow aka Horton overland flow f P qo P f Partial area infiltration excess overland flow P P qo P f P Saturation excess overland flow P qo P qr qs
TOPMODEL Beven, K., R. Lamb, P. Quinn, R. Romanowicz and J. Freer, (1995), "TOPMODEL," Chapter 18 in Computer Models of Watershed Hydrology, Edited by V. P. Singh, Water Resources Publications, Highlands Ranch, Colorado, p.627-668. “TOPMODEL is not a hydrological modeling package. It is rather a set of conceptual tools that can be used to reproduce the hydrological behaviour of catchments in a distributed or semi-distributed way, in particular the dynamics of surface or subsurface contributing areas.”
Stream line Contour line Upslope contributing area a Specific catchment areaa is the upslope area per unit contour length [m2/m m]
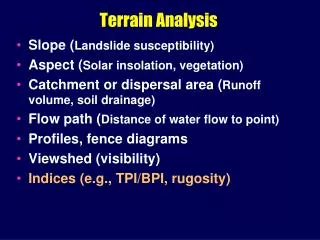
TOPMODEL and GIS Saturation in zones of convergent topography • Surface saturation and soil moisture deficits based on topography • Slope • Specific Catchment Area • Topographic Convergence • Partial contributing area concept • Saturation from below (Dunne) runoff generation mechanism
Slope Specific Catchment Area ln(a/S) or ln(a/tan) [tan=S] is a wetness index that determines the locations of saturation from below and soil moisture deficit.
TOPMODEL soil moisture deficit example • Compute • R=0.0002 m/h • l=6.90 • T=2 m2/hr Given • Ko=10 m/hr • f=5 m-1 • Qb = 0.8 m3/s • A (from GIS) • ne = 0.2 Raster calculator -( [ln(sca/S)] - 6.90)/5+0.46 http://www.engineering.usu.edu/dtarb/rrp.html
Raster calculation – some subtleties Resampling or interpolation (and reprojection) of inputs to target extent, cell size, and projection within region defined by analysis mask + = Analysis mask Analysis cell size Analysis extent
Interpolation Estimate values between known values. A set of spatial analyst functions that predict values for a surface from a limited number of sample points creating a continuous raster. Apparent improvement in resolution may not be justified
Interpolation methods • Nearest neighbor • Inverse distance weight • Bilinear interpolation • Kriging (best linear unbiased estimator) • Spline
Spline Interpolation Nearest Neighbor “Thiessen” Polygon Interpolation
Hydrologic processes are different on hillslopes and in channels. It is important to recognize this and account for this in models. Drainage area can be concentrated or dispersed (specific catchment area) representing concentrated or dispersed flow.
Delineation of Channel Networks and Subwatersheds 500 cell theshold 1000 cell theshold
100 grid cell constant support area threshold stream delineation
200 grid cell constant support area based stream delineation
AREA 2 3 AREA 1 12 How to decide on support area threshold ? Why is it important?
Examples of differently textured topography Badlands in Death Valley.from Easterbrook, 1993, p 140. Coos Bay, Oregon Coast Range. from W. E. Dietrich
Canyon Creek, Trinity Alps, Northern California. Photo D K Hagans
Gently Sloping Convex Landscape From W. E. Dietrich
Same scale, 20 m contour interval Driftwood, PA Sunland, CA Topographic Texture and Drainage Density
“landscape dissection into distinct valleys is limited by a threshold of channelization that sets a finite scale to the landscape.” (Montgomery and Dietrich, 1992, Science, vol. 255 p. 826.) Lets look at some geomorphology. • Drainage Density • Horton’s Laws • Slope – Area scaling • Stream Drops Suggestion:One contributing area threshold does not fit all watersheds.
Drainage Density • Dd = L/A • Hillslope length 1/2Dd B B Hillslope length = B A = 2B L Dd = L/A = 1/2B B= 1/2Dd L
Drainage Density for Different Support Area Thresholds EPA Reach Files 100 grid cell threshold 1000 grid cell threshold
Hortons Laws: Strahler system for stream ordering 1 3 1 2 1 2 1 1 1 1 1 2 2 1 1 1 1 1 1