Download
1 / 15
150 likes | 267 Vues
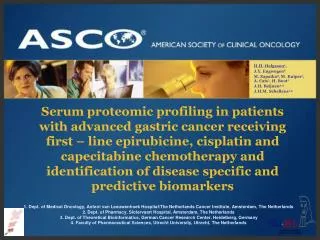
H.H. Helgason 1 , J.Y. Engwegen 2 M. Zapatka 3 , M. Kuiper 1 , A. Cats 1 , H. Boot 1 J.H. Beijnen 2,4 J.H.M. Schellens 1,4.

E N D
H.H. Helgason1, J.Y. Engwegen2 M. Zapatka3, M. Kuiper1, A. Cats1, H. Boot1 J.H. Beijnen2,4 J.H.M. Schellens1,4 Serum proteomic profiling in patients with advanced gastric cancer receiving first – line epirubicine, cisplatin and capecitabine chemotherapy and identification of disease specific and predictive biomarkers 1. Dept. of Medical Oncology, Antoni van Leeuwenhoek Hospital/The Netherlands Cancer Institute, Amsterdam, The Netherlands 2. Dept. of Pharmacy, Slotervaart Hospital, Amsterdam, The Netherlands 3. Dept. of Theoretical Bioinformatics, German Cancer Research Center, Heidelberg, Germany 4. Faculty of Pharmaceutical Sciences, Utrecht University, Utrecht, The Netherlands
Introduction • Gastric cancer is a common cause of cancer deaths • Prognosis depends on stage at diagnosis making early diagnosis mandatory • Specific serum biomarkers of gastric cancer, identified by SELDI-TOF mass spectrometry, could be of great value
Methods - 1 • Patients with advanced gastric cancer receiving 1st line chemotherapy containing Epirubicine 50 mg/m2, Cisplatin 60 mg/m2 i.v. on day 1 and Capecitabine 1000 mg/m2, orally bid on day 1 – 14 every 3 weeks • We collected serum prior to each chemotherapy cycle in gastric cancer patients (GC) and randomly in matched healthy controls (HC), according to standardized protocol
Methods - 2 • Proteomic profiles were generated with SELDI-TOF mass spectrometry, using CM 10 chips with weak cation exchange moiety and buffer pH 5 • We collected serum prior to each chemotherapy cycle in gastric cancer patients (GC) and randomly in matched healthy controls (HC), according to standardized protocol • Serum proteomic profiles of GC were compared to profiles of matched HC allowing identification of serum biomarkers gastric cancer • Mass spectrometry data were processed using the tbimass R-package software (www.r-project.org)
Methods - 3 • To assess the classification accuracy a tenfold repetition of tenfold cross-validation with a nested threefold parameter optimization loop was conducted • Proteomic profile survival prediction was analyzed with COXpath, a predictor-corrector method for drawing the L1 regularization path for the Cox proportional hazards model • Proteomic profile changes according to response and survival and changes developing during chemotherapy were analyzed
Results – 1 • To assess the classification accuracy a tenfold repetition of tenfold cross-validation with a nested threefold parameter optimization loop was conducted • We identified proteins that differentiated between gastric cancer patients and matched healthy controls • Proteins with the highest intensity difference between patients and healthy controls (Figure 1a and b, table 2) serve as a candidate biomarkers for gastric cancer
Results – 2 3892 Da 3892 Da • GC • HC Intensity m/z m/z Figure 1a: Mean spectra of GC and HC; m/z 3892 Da
Results – 3 • GC • HC m/z Figure 1b: Mean spectra of the two groups combined; m/z 3892 Da
Results – 3 Table 2: Most important peaks in the classification model
Results – 4 • By selecting the most differentiating proteins we built a classification model that correctly classified 81% of the gastric cancer patients and 90% of the healthy controls (Figure 2) Figure 2: Diagram of frequency of correct classification by SVM in cross validation Frequency
Results – 5 • There was some difference in classification quality according to measurement day • No proteins were found to be significantly predictive of survival in gastric cancer patients • Few proteins were found to correlate to response to ECC chemotherapy • Analysis of changes occurring in proteomic profiles of patients with advanced gastric cancer during chemotherapy is ongoing
Conclusions • We identified a number of proteins that differentiated between gastric cancer and healthy controls and could serve as a candidate biomarker for gastric cancer • We were able to correctly classify 81% of gastric cancer patients and 90% of healthy controls • We identified few proteins that correlate to response to 1st line palliative ECC chemotherapy serving as potential predictive biomarkers • Serial analysis is ongoing but a number of proteins change during chemotherapy according to response
Background: Gastric cancer is the fourth most commonly diagnosed cancer and is the second leading cause of cancer death worldwide. Prognosis is highly dependent on stage at diagnosis making early diagnosis mandatory. By using SELDI – TOF mass spectrometry we compared serum protein profiles of gastric cancer (GC) patients with healthy controls (HC) and those of gastric cancer patients responding to first-line ECC chemotherapy with those with no response or early progressive disease. Methods: Serum from patients with advanced gastric cancer was obtained, according to a predefined schedule, prior to start of first-line epirubicin (50 mg/m2 day 1), cisplatin (60 mg/m2 day 1) and capecitabine (1000 mg/m2 d1-14) chemotherapy (ECC) and serially before each treatment cycle every 3 weeks and analyzed by SELDI-TOF MS/MS. Samples were drawn according to standardized protocol, centrifuged within 1 hour and stored at -30°C. After thawing they were analyzed with SELDI-TOF MS/MS on CM10 chips at pH 5. Healthy control subjects were matched according to age, gender and time of serum collection. All patients had given written consent, had WHO PS ≤ 2 and measurable disease, according to RECIST criteria, and/or evaluable disease by clinical assessment or tumor marker. Serum proteomic mass spectrometry data of GC patients and matched HC were processed using the tbimass R-package (www.r-project.org) and compared. After pre-processing (resampling, baseline correction, normalisation, alignment correction) support vector machines (SVM) and a specialised variable filtering procedure based on the relative intensity variance were applied for classification. To assess the classification accuracy a tenfold repetition of tenfold cross validation with a nested threefold parameter optimisation loop was conducted. The number of variables used for classification was reduced by recursive feature elimination (RFE).Furthermore we analyzed proteomic profile changes association with chemotherapy response, gastric cancer patient survival and for changes developing during chemotherapy (ongoing).For the serial analysis the time points T: 0, 6, 12 and 18 - 24 weeks were used.
Results: In total 82 patients with adenocarcinoma of the stomach (mean age 57 years, male 70%) were treated between 06/2003 and 11/2006 with mean 5 ECC cycles. Response rate was 37% (5 CR, 20 PR) with additionally 12 patients developing stable disease of more than 6 months duration but 5 patients were primarily progressive. Seven patients were not assessable because of additional surgery and other 7 patients were not evaluable. The median time to progression was 7 months (95% CI: 6 - 8). and median overall survival 11 months (95% CI: 9.5 - 12). All patients were previously untreated except respectively 1 and 8 patients who had received chemo-radiotherapy and radiotherapy for proximal gastric carcinoma (all > 6 months previously). Serum from 77 HC was collected. By comparing GC patients and HC we identified number of proteins that differentiated between the two groups. By selecting the most differentiating proteins we built a classification model that correctly classified 81% of the gastric cancer patients and 90% of the healthy controls. Specific prognostic proteomic profile for gastric cancer patients was not found. Few proteins were found to correlate to response serving as potential predicting biomarkers. Proteomic profiling of serial serum collections during chemotherapy in GC is ongoing but some proteins change according to response during chemotherapy serving as potential biomarker for treatment monitoring. Conclusion: We identified number of proteins that differentiate between gastric cancer and healthy controls by proteomic profiling with SELDI-TOF MS/MS. By using the most discriminating proteins we were able to correctly classify 81% of the gastric cancer patients and 90% of the healthy controls serving as candidate diagnostic biomarkers.


![1. 400 m 2. 200(1 + p ) m 3. 200[1 + ( p /2)] m 4. 200[1 + ( p /4)] m 5. zero](https://cdn3.slideserve.com/5442402/slide1-dt.jpg)