Download
1 / 1
10 likes | 97 Vues
3 Dimensional Climatology of African Dust Aaron Adams Rosenstiel School of Marine and Atmospheric Science (RSMAS), University of Miami; aadams@rsmas.miami.edu. Objective. 3D Frequency of Occurrence. Summer Dust. Winter Dust.

E N D
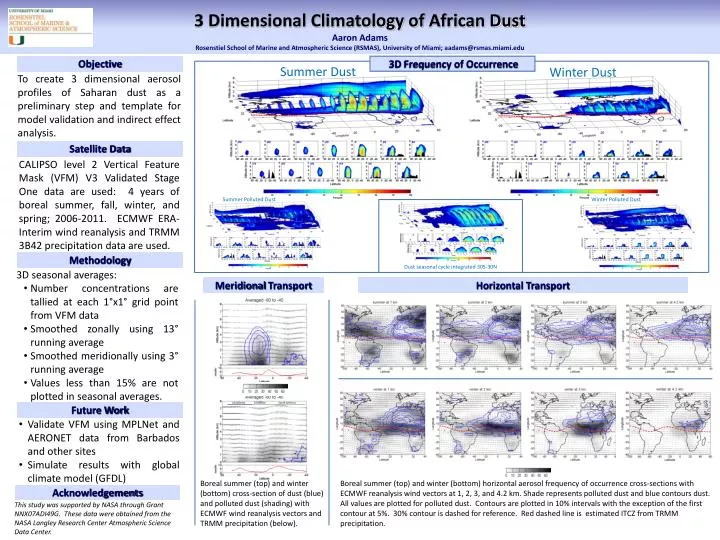
3 Dimensional Climatology of African Dust Aaron Adams Rosenstiel School of Marine and Atmospheric Science (RSMAS), University of Miami; aadams@rsmas.miami.edu Objective 3DFrequency of Occurrence Summer Dust Winter Dust To create 3 dimensional aerosol profiles of Saharan dust as a preliminary step and template for model validation and indirect effect analysis. Satellite Data CALIPSO level 2 Vertical Feature Mask (VFM) V3 Validated Stage One data are used: 4 years of boreal summer, fall, winter, and spring; 2006-2011. ECMWF ERA-Interim wind reanalysis and TRMM 3B42 precipitation data are used. Summer Polluted Dust Winter Polluted Dust Methodology Dust seasonal cycle integrated 30S-30N • 3D seasonal averages: • Number concentrations are tallied at each 1°x1° grid point from VFM data • Smoothed zonally using 13° running average • Smoothed meridionally using 3° running average • Values less than 15% are not plotted in seasonal averages. Meridional Transport Horizontal Transport US/Atlantic Caribbean South America US/Atlantic Caribbean South America Future Work • Validate VFM using MPLNet and AERONET data from Barbados and other sites • Simulate results with global climate model (GFDL) Boreal summer (top) and winter (bottom) cross-section of dust (blue) and polluted dust (shading) with ECMWF wind reanalysis vectors and TRMM precipitation (below). Boreal summer (top) and winter (bottom) horizontal aerosol frequency of occurrence cross-sections with ECMWF reanalysis wind vectors at 1, 2, 3, and 4.2 km. Shade represents polluted dust and blue contours dust. All values are plotted for polluted dust. Contours are plotted in 10% intervals with the exception of the first contour at 5%. 30% contour is dashed for reference. Red dashed line is estimated ITCZ from TRMM precipitation. Acknowledgements This study was supported by NASA through Grant NNX07ADI49G. These data were obtained from the NASA Langley Research Center Atmospheric Science Data Center.