7 -2
7 -2. Correlation Coefficient. Objectives Determine and interpret the correlation coefficient . C orrelation coefficient is always between -1 and +1. Weak correlation is closer to zero and strong correlation is closer to either -1 or +1.

7 -2
E N D
Presentation Transcript
7-2 Correlation Coefficient • Objectives • Determine and interpret the correlation coefficient.
Correlation coefficient is always between -1 and +1. Weak correlation is closer to zero and strong correlation is closer to either -1 or +1. Ex. r = 0.21 or -0.21 (weak), r = -0.98 or 0.98(strong). If correlation is equal to exactly -1 or +1 then the data points all fall on an exact straight line. Correlation Coefficient - Facts
Examples of Approximate r Values y y y x x x r = -1 r = -.6 r = 0 y y x x r = +.3 r = +1
7. Estimate the correlation coefficient (r-value). Correlation Coefficient r = 0.9
7. Estimate the correlation coefficient (r-value). Correlation Coefficient
8. Estimate the correlation coefficient (r-value). Correlation Coefficient
8. Estimate the correlation coefficient (r-value). Correlation Coefficient r = 0.4
9. Estimate the correlation coefficient (r-value). Correlation Coefficient
9. Estimate the correlation coefficient (r-value). Correlation Coefficient r = 0
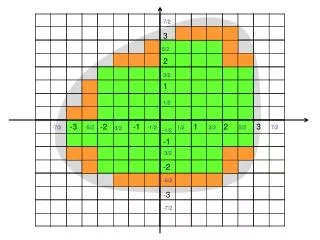
10. a) draw a scatter plot of the data b) draw in the best fit line 30 32 34 36 38 40 15 20 25 30 35 40 45 50 55 60 65 70
10. a) draw a scatter plot of the data b) draw in the best fit line 30 32 34 36 38 40 15 20 25 30 35 40 45 50 55 60 65 70
10. c) find the equation of your best fit line Y-intercept 30 32 34 36 38 40 42 44 45 -4 Slope 15 1 45 50 55 0 5 10 15 20 25 30 35 40 45 50 55 60 65 70
10. d) estimate y when x = 20 30 32 34 36 38 40 42 44 About 40 1 45 50 55 0 5 10 15 20 25 30 35 40 45 50 55 60 65 70
11. Find the correlation Coefficient 30 32 34 36 38 40 15 20 25 30 35 40 45 50 55 60 65 70
Classwork/Homework 7-2Worksheet