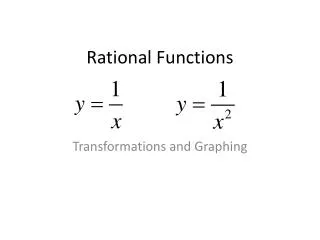
RATIONAL FUNCTIONS
CURVE SKETCHING. RATIONAL FUNCTIONS. RATIONAL FUNCTIONS EXAMPLE 1 a) Domain Since x 2 + x – 2 ≠ 0 ( x + 2)( x – 1) ≠ 0 x ≠ – 2 x ≠ 1 x e R b) x -intercepts y - intercept c) Tests for symmetry Circle the correct answer.

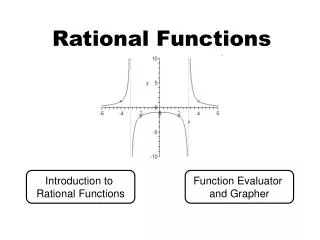
RATIONAL FUNCTIONS
E N D
Presentation Transcript
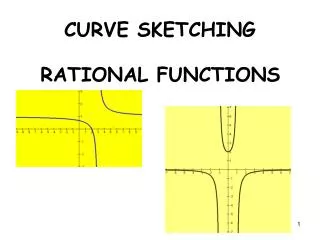
CURVE SKETCHING RATIONAL FUNCTIONS
RATIONAL FUNCTIONS EXAMPLE 1 a) Domain Since x2 + x – 2 ≠ 0 (x + 2)(x – 1) ≠ 0 x ≠ – 2 x ≠ 1 xe R b) x-intercepts y-intercept c) Tests for symmetry Circle the correct answer. This function is: a) even b) odd c) neither d) Asymptotes f (x) ( = / ≠) f(–x) The graph (is / is not) symmetrical to the y-axis. – f (x) ( = / ≠) f(–x) The graph (is / is not) symmetrical to the y-axis. Vertical asymptote at x = –2 “Hole” at Horizontal asymptote at y = 1
Now let’s look at the one-sided limits around • Label the x and y- intercepts with ordered pairs • Label the “hole” with an ordered pair • Draw in the asymptotes and write their equations • show how the graph behaves left and right of the vertical asymptote
EXAMPLE 1 a) Domain x ≠ 4, xe R b) x-intercepts y-intercept DNE
c) Tests for symmetry f (x) ( = / ≠) f(–x) The graph (is / is not) symmetrical to the y-axis. – f(x) = – f(x) ( = / ≠) f(–x) The graph (is / is not) symmetrical to the origin. Circle the correct answer. This function is: a) even b) odd c) neither
d) Asymptotes DNE DNE Vertical Asymptote at x = 4 Now lets look at the one-sided limits around x = 4 - ∞ ∞ 0 Horizontal Asymptote at y = 0
e) First Derivative Test: Find intervals of increase and decrease. decreasing This graph is always ____________________ because f '(x) is always ________________ negative
+ 4 f) Concavity: This can change when the second derivative is undefined if The graph is concave down over the interval x < 4 The graph is concave up over the interval x > 4
Graph #1 • Using ordered pairs, • label the x and y-intercepts, • draw in any asymptotes and label with their equations • show how the graph behaves left and right of the vertical asymptote ∞ y = 0 - ∞ x = 4
Graph #2 Highlight the increasing sections and / or the decreasing sections decreasing decreasing
Graph #3 Highlight the concave up sections and concave down sections. CU CD
a) Domain x ≠ -2, x e R EXAMPLE 2 b) x-intercepts y-intercept DNE c) Tests for symmetry f (x) ( = / ≠) f(–x) The graph (is / is not) symmetrical to the y-axis. – f(x) ( = / ≠) f(–x) The graph (is / is not) symmetrical to the origin. Circle the correct answer. This function is: a) even b) odd c) neither
0 d) Asymptotes DNE DNE Vertical Asymptote at x = -2 Now lets look at the one-sided limits around - ∞ - ∞ Horizontal Asymptote at y = 0
+ - 2 e) First Derivative Test: Find intervals of increase and decrease. Interval of increase: x > -2 Interval of decrease: x < -2
- 2 f) Concavity: This can change when the second derivative is undefined if The graph is always ________________ (CU / CD) because f "(x) is always _________________ (positive / negative)
x = -2 y = 0 - ∞ - ∞ • Graph #1 • Using ordered pairs, label the x and y-intercepts, • draw in any asymptotes • show how the graph behaves left and right of the vertical asymptote
Graph #2 Highlight the increasing sections and the decreasing sections decreasing increasing Graph #3 Highlight the concave up sections and concave down sections. CD CD
EXAMPLE Since x2 + 3 ≠ 0 xe R Domain: yintercept x-intercepts (0, 0) (0, 0)
Tests for symmetry • f(–x) = • f (x) (= / ≠) f(–x) • The graph (is / is not) symmetrical to the y-axis. – f(x) = = – f(x) ( = / ≠) f(–x) The graph (is / is not) symmetrical to the origin.
Asymptotes x2 + 3 ≠ 0 Therefore there are no vertical asymptotes Horizontal asymptote at y = 1
min (0, 0) + 0 Intervals of Increase or Decrease(First Derivative Test) Increase:x > 0 Decrease:x < 0 6x = 0 x = 0
Local Maximum and Minimum Valuesby second derivative test positive so (0, 0) is a minimum
+ CD -1 CU 1 CD Concavity and Points of Inflection The graph is concave down over the intervals x < -1 or x > 1 The graph is concave up over the interval -1 < x < 1
Graph #1 Using ordered pairs, label the xand y-intercepts, draw in any asymptotes y = 1 (0, 0)
Graph #2 Label any turning points with ordered pairs Highlight the increasing sections and the decreasing sections increasing decreasing (0, 0)
Graph #3 Label the inflection points with ordered pairs. Highlight the concave up sections and concave down sections. (1, ¼ ) (-1, ¼ ) CD CD CU