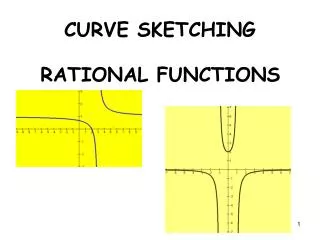

RATIONAL FUNCTIONS
E N D
Presentation Transcript
1. RATIONAL FUNCTIONS GRAPHS & ANALYSIS
2. Real Life A certain company burns coal to generate electricity. The cost (C) of removing p% of the smokestack pollutants is
C = 80,000p
100 � p
What is the domain?
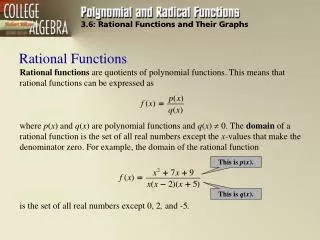
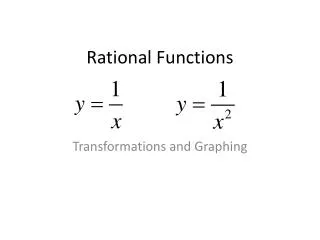
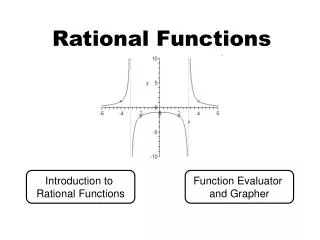
3. The Basic Rational Function A Rational function is formed by the ratio of two polynomials (fractional form): f(x) = N(x)
D(x)
Basic f(x) = 1
x
Vertical asymptote x=0
where f(x) undefined
so as x?0 f(x)???
Horizontal asymptote y = 0
since as x? ?? f(x)?0
4. Asymptotes Divide the variable terms of highest exp (degree)
The result shows horizontal or slant asymptotes
Draw all asymptotes as dashed lines
EX: F(x) = 3x3 � 2x +1 ? 3x3 ? 3/2 = y
2x3 � 4 2x3
EX: G(x) = 1 � x ? -x ? -1 = y
x x
EX: H(x) = 2x2 ? 0 = y EX: f(x)= 3x2 ? y=3x
x3 x slant
5. Asymptotes cont� Vertical Asymptotes occur at x value(s) that make f(x) undefined (Denominator = 0)
Ex: F(x) = 4x+1 ? 4x+1
x2-x x(x-1) ? x = 0 & x = 1
6. Graphing Guidelines Let x= 0 to find any y-intercepts unless x ? 0
Set N(x) = 0 and solve for any x-intercepts
Set D(x) = 0 to find x value(s) for vertical asymptote(s) and use dashed line
Divide leading terms to find remaining asym
Find & plot at least one point between and beyond each x-int and vertical asymptote
Use smooth curves to complete the graph
7. Graphing Example Graph f(x) = 3x + 1
x
X ? 0 so no y-int
3x+1 = 0 ? x = -1/3 is x-int
X = 0 vertical asym
3x ? 3 = y horizontal asym
x
Plot pts between & beyond
X-int and asymptote
(-1,2) (-3,8/3)(1/3,6)(2,7/2)
8. Graphing Example 2 Graph f(x) = 2(x2 � 9)
x2 � 4
y-int:
x-int:
v-asym:
Other asym:
Additional points: