Download
1 / 33
330 likes | 527 Vues
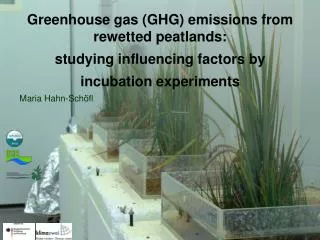
Greenhouse gas (GHG) emissions from rewetted peatlands: studying influencing factors by incubation experiments. Maria Hahn-Schöfl. Definitions. Peatland = all soils with organic layer > 30 cm and water saturation at least during part of the year Fen = peatland influenced by groundwater

E N D
Greenhouse gas (GHG) emissions from rewetted peatlands:studying influencing factors by incubation experiments Maria Hahn-Schöfl
Definitions • Peatland = all soils with organic layer > 30 cm and water saturation at least during part of the year • Fen = peatland influenced by groundwater • Bog = peatland influenced by rainwater (raised above groundwater influence) • Mire = undisturbed peatland
Importance of peatlands (worldwide) • small area: peat cover = 3% of land area (7% in EU-25) • storage of large amount of C: ~ 30% of soil C ~ 70% of atmospheric C
25000 -equ] 20000 2 15000 10000 GHG balance [Gg CO 5000 0 -5000 Belarus Germany Sweden Norway Finland Poland Ireland Estonia (Drösler et al. 2008) United Kingdom Importance of German peatlands • German peatlands = 3% of EU land area • total C stored ~ 1070 - 2400 Mio. t C • 80% of German peatlands are used in agriculture ( drainage changes in GHG fluxes) • drained peatlands emit 4.5% of the total German GHG emissions • in EU-25: Germany is largest emitter of GHG from peatlands
Peat profile Consumption Production Soil surface Aerobic organic substrate CO2 CH4 N2O Capillary fringe Water table Anaerobic Greenhouse gases (GHG) in peatlands GHG balance is determined by production and consumption of CO2, CH4 and N2O
TG3 TG1 TG2 TG4 TG5 TG6 Studying GHG fluxes in German peatlands • Integrative project “Climate mitigation via peatland management” (2006-2010) • financed by BMBF • Aim: • Field measurements of GHG fluxes on 6 German peatlands differing in management and water table position (over 2 years) • Incubation experiments: to gain more knowledge on processes (manipulation of e.g. water table, radiation, temperature, substrate)
Parameter influencing the climate impact of fen and bogs GHG balance [t CO2-equ. ha-1 a-1] C export [t CO2-equ. ha-1 a-1] Mean water table [cm]
Effect of substrate on GHG exchange • Site „Zarnekow“ high CH4 emissions after rewetting why ? • Incubation experiments without vegetation • Questions to be answered: • What is the main substrate for microbial processes? • What is the reason for high CH4 emissions ( high climate impact)? • When after inundation do high CH4 emissions occur? • Hypothesis: • Litter from recently died-off plants causes high CH4 emissions
Sampling site Fen: Polder Zarnekow (Mecklenburg-Vorpommern) Drainage in 18th century, use as grassland (extensive in 19th, intensive in 20th century) rewetting in Oct 2004 inundation prior to rewetting / inundation (2004)
Sampling site Vegetation: dominated by reed canary grass (Phalaris arundinacea) died off during 1st year after rewetting/inundation during 2nd year: high nutrient concentrations growth of water plants (Ceratophyllum,Lemna sp.) died off formation of organic sediment layer (= plant litter + sand) inundation (11/2005) prior to rewetting / inundation (2004) inundation (04/2005) inundation (06/2006) 08/2008
Incubation & parameter measured long incubation short incubation sampling priorrewetting post rewetting substrates incubated peat from different soil depths (upper, middle, lower peat layer) upper peat layer only / differing in the amount of fresh plant litter or rootspresent (organic sediment, peat with roots, peat only) duration long (363 days) short (53 days) conditions constant temperature, no light, water-saturated conditions • measurement CO2 und CH4 emissions from substrate surface • analysis of pore water chemistry
modified from Zak & Gelbrecht (2008) Results: long incubation
Conclusions • What is the main substrate for microbial processes? organic sediment (mix of sand + fresh plant litter) substrate for microbial degradation high CO2 and CH4 emissions peat (without any fresh litter): low potential upper peat layer (peat with C from rhizodeposition): slow, continuous emission of CO2; retarded start of methanogenesis (>150 days) • What is the reason for high CH4 emissions? vegetation is not adapted to inundation died off accumulation of plant litter high potential for CH4 production • When after inundation do high CH4 emissions occur? upper peat layer: rewetting event reaching anaerobiosis (>150 days) organic sediment: immediately (already anaerobic) peat with roots: ~ 3 weeks
slightly drained Renaturation: flooded Management options to avoid high CH4 emissions CO2, CH4, N2O Renaturation: flooded Renaturation: flooded Permanendly flooded Alternation of dry and flooded periods
Effect of water level on GHG exchange • Incubation experiments of peat cores with vegetation • Questions to be answered: • How is the GHG exchange affected by water level change? How is CO2 exchange affected by changing water level? At which water level do significant CH4 emissions start? Does a dynamic water level reduce CH4 emissions? Trade-off between N2O and CH4 emissions at dynamic water level (gradient oxic/anoxic ideal conditions for denitrification) • How could potentially high CH4 emissions be reduced after rewetting?
Sampling site extensively managed meadow (sedges) intensively managed meadow (grass) • Fen: Freisinger Moos (Bayern) • drained; use in agriculture • extensively managed meadow (sedges) • intensively managed meadow (grass) • Sampling of intact peat cores with vegetation
Parameter measured • Water level: • rising in steps: - 30 -20 -10 -5 0 (for 1 month) +5 cm (for 3 months) • in 4 cycles: 1 week dry (-30 cm) 6 weeks flooding (+5 cm) • CO2 exchange • CH4 and N2O emissions • Radiation (PAR) • Air temperature • Soil temperature
Net ecosystem exchange (NEE) water level -5 cm intensively managed extensively managed Results: CO2 exchange temperature level 23°C PAR = 915 µmol m-2 s-1 water level raised stepwise (-30 +5 cm)
Ecosystem respiration (Reco) Gross primary production (GPP) water level +5 cm intensively managed extensively managed Results: CO2 exchange temperature level 23°C PAR = 915 µmol m-2 s-1 water level raised stepwise (-30 +5 cm)
extensively managed intensively managed CH4 flux [mg C m-2 h-1] Incubation period [days] Results: CH4 emissions water level raised stepwise (-30 +5 cm)
Results: CH4 emissions intensively managed CH4 flux [mg C m-2 h-1] Incubation period [days] water level in cycles (-30 +5 cm)
extensively managed intensively managed N2O flux [mg C m-2 h-1] Incubation period [days] Results: N2O emissions water level raised stepwise (-30 +5 cm)
Conclusions How is the GHG exchange affected by water level change? • CO2 Stepwise raising the water level: continuous decrease of ecosystem respiration and gross primary production • CH4 Emissions increase exponentially at a water level of -5 cm Significantly lower methane emissions when flooding periods are interrupted by short dry periods • N2O In general: very low emissions (also at dynamic water level!)
Conclusions How could potentially high CH4 emissions be reduced after rewetting? risk of high emissions is due to waterlogged conditions and the simultaneous presence substrate for decomposition processes • no permanent flooding when easily degradable dead organic matter is present or freshly produced by plants • interupt flooding by short dry periods • hold water level at – 10 cm in summer • avoid accumulation of organic substrate • avoid dying off of present plants (water level) • facilitate colonization by adapted plant species (e.g. Typha sp., reeds or sedges) • remove fresh plant litter (organic sediment)
Outlook: comparison lab - field • Comparison of modelling parameter (Rref, E0, GPmax, alpha) work in progress • Ongoing manipulation experiment in Freisinger Moos by TUM (effect of water level and temperature)
Acknowledgements Experiments without vegetation: co-operation with ZALF and IGB (Dominik Zak, Jörg Gelbrecht, Jürgen Augustin, Merten Minke) Incubation of peat cores with vegetation in the climate chamber: technical support by mechanics and electronic workshop, central field instrumentation facility, RoMa, SpecLab, students, diploma student Jan Heinichen …. Angelika Thuille: supervision of experiment, evaluation and analysis of CH4 / N2O data Annette Freibauer: PhD supervisor Gerhard Schöfl: support in preparation, evaluation and analysis of CO2 data
extensive intensive extensive intensive CO2 data: modelling parameter
soil depth 5 cm 10 cm 20 cm 15 cm 30 cm Results: Redox potential in 5 soil depths