Process Control
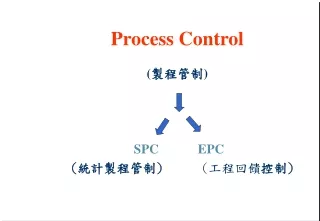
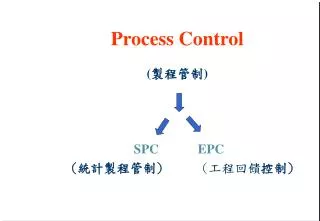
Process Control. (製程管制) SPC EPC ( 統計製程管制) (工程回饋 控制). Process Control Techniques. SPC (Statistical Process Control):Parts industry Control Chart (W. A. Shewhart, 1920) Applied Statistics and Industrial Engineering EPC (Engineering Process Control):continuous process

Process Control
E N D
Presentation Transcript
Process Control (製程管制) SPCEPC (統計製程管制) (工程回饋控制)
Process Control Techniques • SPC (Statistical Process Control):Parts industry • Control Chart (W. A. Shewhart, 1920) • Applied Statistics and Industrial Engineering • EPC (Engineering Process Control):continuous process • Feedback Control Scheme (Box and Jenkins, 1976) • Chemical and Electrical Engineering
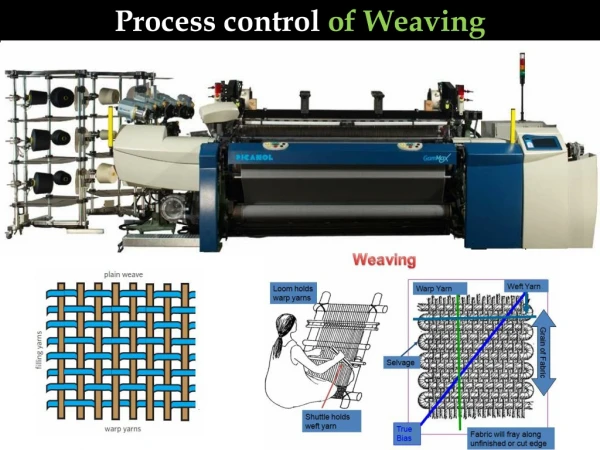
Main idea of SPC • To monitor the stability of product’s quality characteristics (measurable attributes). • Process monitoring is more passive action • Common and assignable causes variability • In-control state and out-of-control (OOC) state • Control chart distinguishes these two states. • Process unchanged if no OOC signal appears • Take action if OOC signal has been detected
Disturbance Process Input Output Feedback Control Engineering Feedback Control (EPC)
Either SPC or EPC are not enough in IC manufacturing process 1. SPC only detects the changes of process but does not prescribe suitable control actions. 2. IC manufacturing process consists of several chemical-based, batch-by-batch sub-processes. 3. EPC can not be used directly. The reasons are (a) A precise I-O model is unknown; (b) EPC has the danger of over-adjustment.
Run by Run (RbR) Control 針對 IC 產業 Run-by-Run 之特性所發展出 來的製程管制方法,它整合 • DOE (Design of Experiment) • EPC (Engineering Feedback Control) • SPC (Statistical Process Control) 之優點來監控 IC 生產製程。
RSM Post-measured data No A new recipe No change Yes Out of deadband? No SPC Out of limits of the recipe? Yes Clean and maintain start 批次控制架構 (Run by Run Control) Optimal Update Feedback control EPC
Process EWMA controller The case of SISO System Question : (1) stability conditions (2) optimal discount factor ω
FF Dimension offset of Mask Supervisory APC of Poly-Loop for Isat CMP Cpk improve 20-30 % Device Cpk improved 20-30% ADI CD Cpk improve 20-30 % AEI CD CPK improve 10-25% FF FF FF FF FF Film information CVD CMP Poly Photo Poly Etch Implant ADI CD AEI CD electrical performance FB FB FB FB NTO (New Tape Out) rework rate reduce 20-30%
FB FB to control island Supervisory APC of Cu Resistance Cpk of Cu-Rs improved 30-40% FF of OX thickness FF of OX CD WAT/CP performance OX Film Cu ECP CMP Thk after CMP Metal trench etch OX THK trench CD Cu THK FB FF of Cu thickness FB of remained thk : Feed forward : Feedback FF FB
FDC Benefits • Learn more about the equipment behavior • Learn more about the process behavior • Improve the equipment reliability • Reduce the number of test wafers • Match chambers and equipments • Identify the root cause of faults • Optimize the frequency and the nature of PMs • Reduce wafer scrap • Capitalize process knowledge and experience
FDC methodology Collect temporal data and record it in a data base Data Collection Visualize the temporal data Data Monitoring Pretreatment Choose the correct pretreatment to summarize data Setup upper and lower limits for each summarized data Build a multivariate model including T² global indicator and faults signatures Define a corrective action on both SPC and GPC fault detection GPC Model Univariate SPC Model SPC OCAPs GPC OCAPs
FDC methodology Step 0 - Data Collection • Goal • Collect the necessary data that will be used to represent and understand the process and/or the equipment behavior. • Benefits • Choose the parameters to collect • Equipment status variables (SVID) • Analog and digital inputs • External sensors • Choose the sampling rate for each parameter • Define the Start and Stop events that trigger the data collection (Recipe name, Steps numbers ...)
FDC methodology Step 1 - Data Monitoring • Goal • Visualize the temporal data to understand each physical parameter • Benefits • Choose and visualize the relevant temporal variables • See if the variable is meaningful, synchronized with the run ... • Control the temporal behavior • Start and stop manually the real time data collection
FDC methodology Step 2 - Pre-treatment • Goal • Summarizing temporal data in one or several indicator(s) called univariate data. According to the temporal behavior of the variable, this summary may be a mean, a range, a standard deviation etc…and becomes time independent. • Benefits • Create several summarized indicators with only one temporal data. • Choose the temporal data and associate a pre-treatment. • Visualize the new summarized indicator on a graph
FDC methodology Step 2 – Pre-treatment Data Base Table for Univariate data Temporal collected Data Pre-treatment (mean, range etc…) Univariate Chart
FDC methodology Step 3 - Modeling • Goal • Create a reference of the good behavior of the process • Benefits • Automatic control of the process by FDC
SPC Chart T2 Chart Alarm Index Chart Sensitivity Chart FDC methodology Step 3 - Modeling Univariate Data (Pretreated) Modeling (SPC/GPC) Models
FDC methodology Univariate Modeling with SPC • Goal • Control the process variables with a univariate criteria the control limits.Each control depends on a probability of false alarm. • Benefits • Control limits are either statistical or specified • Several control limits aims to have several levels of severity.
FDC methodology Univariate Modeling with SPC Univariate Data Controllimits Univariate Chart including all upper and lower limits
FDC methodology Multivariate Modeling with GPC • Goal • Control the process by • using Hotelling T² probabilistic limit to discriminate Out of Control wafers from the Under Control wafers. • using GPC factorial analysis to classify out of control wafers and to provide a list of Fault Signature • Benefits • Use the control charts and sensitivity charts to analyze the abnormal behaviors and to understand the origin of the anomalies.
FDC methodology Multivariate Modeling with GPC Choice of the GPC input indicators Univariate Data Close to random gaussian behavior?
FDC methodology Multivariate Modeling with GPC GPC Model Parameters Discrimination & Fault Classification Univariate Data Classification & Fault Signature Alarm level
FDC methodology Step 4 – OCAP • Goal • Act to better control the process • Benefits • Use SPC/GPC analysis to build the OCAPs • OCAPs automatically implemented
Data Quality Data Quality is • Data AvailabilitySame data that the equipment supplier requires for the purposes of tool control • Sampling RateData shall be provided with a sampling rate at least twice, as a minimum, the period of the shortest anomaly or signature to be detected on the signal • Data ResolutionResolution of no less than .1% of normal operating range • Data AccuracyAn absolute accuracy of no less than .05% of normal operating range
Data Quality Data Quality is • Data collection Triggermust have the ability to be triggered based on a command from the host, on a recipe step, a specified equipment event or a combination of specified equipment events • Data DeliveryData shall be made available to internal or external systems within 50 milliseconds of being sampled • Time and Date StampData must be time and date stamped, and synchronized.Time-stamping must correspond to the occurrence of the corresponding event or sample value. • Sensor trackingSensors providing data shall provide the means of tracking their make, model, serial number. And last bench calibration date.
Pre-treatment Summarization Formula Samples
Pre-treatment • What is important in this temporal chape? • How to highlight it? Other algorithms Standard Deviation Algorithm Mean Algorithm Standard deviation aims to highlight the stability in the variations Mean aims to highlight the stability in mean
Slope Offset ObservationID Pre-treatment • Regression • This summarization allows controlling the slope and offset of temporal drifts. • The results of this time regression are 2 indicators, the 2 coefficients of regression: ObservationID Time
Final Exam Questions: • Please explain APC function, and describe the benefit of APC function in semiconductor industry. (20%) • Please explain FDC function, and describe the benefit of FDC function in semiconductor industry. (20%) • Please describe the challenges of implementing the APC in semiconductor industry. (15%) • Please explain the integrated synergy of APC and FDC working model. (20%) • Please describe the data quality defined to support FDC functions. (10%) • Please illustrate several pre-treatmenet for convert FDC’s temporal charts into SPC charts. (15%)