Download
1 / 67
670 likes | 878 Vues
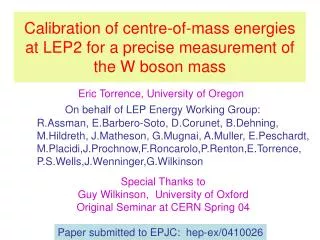
Calibration of centre-of-mass energies at LEP2 for a precise measurement of the W boson mass. Eric Torrence, University of Oregon. On behalf of LEP Energy Working Group:. R.Assman, E.Barbero-Soto, D.Corunet, B.Dehning, M.Hildreth, J.Matheson, G.Mugnai, A.Muller, E.Peschardt,

E N D
Calibration of centre-of-mass energiesat LEP2 for a precise measurement of the W boson mass Eric Torrence, University of Oregon On behalf of LEP Energy Working Group: R.Assman, E.Barbero-Soto, D.Corunet, B.Dehning, M.Hildreth, J.Matheson, G.Mugnai, A.Muller, E.Peschardt, M.Placidi,J.Prochnow,F.Roncarolo,P.Renton,E.Torrence, P.S.Wells,J.Wenninger,G.Wilkinson Special Thanks toGuy Wilkinson, University of Oxford Original Seminar at CERN Spring 04 Paper submitted to EPJC: hep-ex/0410026
Outline of Seminar Ecm and the W mass measurement • Tools of energy calibration: • Resonant depolarisation and the NMR magnetic model • Other ingredients of the energy model • Tests of the NMR model: • Flux Loop • Spectrometer • Qs Bulk of talk! Other uncertainties – error summary Conclusions
W mass at LEP 2 • Most important result from LEP 2 is the W mass measurement • Check agreement with LEP1/SLD predictions • Points us to the Higgs • When the Higgs is found, a stringent consistency test can be performed
The need to know ECM W mass measurement exploits kinematic fit with ECM as constraint MW / MW = ECM / ECM LEP2 statistical error on MW is about 30 MeV. Sets goal of: ECM / ECM = 1-2 x 10⁻⁴ Ecm is the only W mass error fully correlated between all experiments and channels!
Resonant Depolarisation (RDP) • Wait for transverse polarisation to build up • Precession frequency, ns , directly proportional to Eb Eb = 2 ns me c2 / (ge – 2) • Monitor polarisation whilst exciting beam with transverse oscillating B field Intrinsic precision of RDP is 10-6 ! RDP is the tool that made LEP1 Z scans such a success:
RDP at LEP 2 RDP is however no use at W production energies! Machine imperfections that destroy polarisation become more and more important with energy This because energy spread of beam increases Negligible polarisation levels above 60 GeV! So we need indirect means of Eb determination at LEP2
NMR magnetic model Fundamental expression of LEP2 Eb calibration: Eb = (ec/2)∫ B ds o Magnetic measurements available from 16 NMRs in selected dipoles Calibrate NMR readings against RDP over interval where both exist (41-61 GeV) in 2 parameter fit. Apply at high energy. Average of probe predictions defines the LEP2 energy scale!
Other Ingredients in Energy Model • Having set energy scale from dipoles then apply corrections: • Not only dipoles which contribute to ∫ B ds ! • Quadrupole effects, eg. ‘earth tides’ • Also important to understand energy variations with time: • Short term variation in dipole fields, eg. temperature & TGVs • In principle well understood from LEP 1 (critical for Z mass!). o
Quadrupole Effects Distortions to LEP ring from ‘earth tides’ & changes in lake level lead to off-centre orbits in quadrupoles Autumn, 1992 Optics mean fractional energy changes are 10,000 times larger than circumference changes!
Dipole Field Rise Dipole fields and hence energy known (since 1995) to rise during fill… …apart from during period between midnight and 4:00h (Very important effect in measurement of Z mass!)
The ‘TGV’ Effect Explanation: magnets being ‘tickled’ by vagabond currents from (daytime) trains leaking onto the vacuum pipe
LEP2 test of combined tide & trains Extra LEP2 instrumentation (16 NMRs) motivated test of LEP1 tide/train model. Predictions of model vs time 1999 Compare model predictions with RDP measurements over 6 hour period Degree of agreement will tell us how good a job we did for Z mass and give confidence for the W…
LEP2 test of combined tide & trains Superimpose measurements made by RDP (normalised to model in first 30 minutes) Excellent agreement ! This very good news for mZ ! But for mW the big issue is the absolute energy scale.
NMR magnetic model Calibrate NMR readings against RDP over interval where both exist (41- 61 GeV) in 2 parameter fit. Apply at high energy. Average of probe predictions defines the LEP2 energy scale! $64,000,000 question: how trustworthy is model?
How reliable is the NMR model ? • Study fit residuals year-by year. Stable behaviour! Evidence of (small) non-linearity. How does this evolve at high energy? • 16 NMRs, but 3200 dipoles! Is our sample representative? For reliable W mass measurement, the validity of the model at high energy needs to be demonstrated!
Overview of NMR model tests 3 independent methods have been used to assess the validity of the NMR model at high energy Flux-loop Compare NMR behaviour with more complete magnetic sampling provided by flux-loop Spectrometer Measure deflection of beam in magnet of known integrated field Synchrotron tune (Qs) analysis Fit variation of Qs with RF voltage. From this extract Eb.
Flux loop (FL) Copper loops connected in series allow the change of flux to be measured through (almost) all dipoles No useful way to extract absolute Eb value from FL Rather, ramp machine in dedicated experiments and compare evolution of FL readings with NMRs DFL provides method of testing NMR sampling accuracy
Flux Loop Results, year by year FL value – NMR prediction (expressed as equivalent energy; each entry is a separate ramp, averaged over all available NMRs) If FL values are proportional to true Eb, can make fit of NMR vs FL, à la NMR vs RDP fit Having made fit at fields corresponding to low energies, compare fit predictions and FL values at high energy Fit prediction agrees with FL, within a few MeV. No evidence of significant non-linearity!
Flux Loop Results vs Energy FL results can be integrated over all years, and the dependence on energy studied. Results suggest a small offset in the NMR model, and one which evolves slowly with energy. FL -NMR prediction vs Eb
Flux Loop Error Assignment Lack of redundant info in the FL data hinders rigorous error assignment Best indication comes from comparing low energy RDP- NMR and FL-NMR residuals Re-do fits in 41-50 GeV region and study residuals at 55-61 GeV This difference extrapolated up to high energy quantifies the linearity of the FL itself.
Flux Loop Summary Error assignment comes primarily from residual analysis (15 MeV at Eb=100 GeV). Additional components arise from considering linearity of dipole area lying outside FL cable & uninstrumented magnets in eg. injection region (sum to 5 MeV at Eb=100 GeV). All errors scale with Eb. Example Eb 72 GeV 100 GeV 106 GeV FL-NMR Offset [MeV]-1.7 -5.2 -6.0 Assigned error [MeV] 7.5 15.8 17.6
LEP In-Line Energy Spectrometer Idea (’97): measure deflection of beam in magnet of LEP lattice Required precision makes absolute measurement impossible… …rather make 2 consecutive measurements close in time in same fill: one at reference energy in regime well understood by RDP; the second at the energy of interest.
Spectrometer Layout Spectrometer installed close to IP3 and commissioned during 1999. Data taking for Eb measurements in 2000. Required precision on position measurements ~ 1 micron; on ∫B.dl ~10-5 . Recall these accuracies must be attained on measurements of changes between reference & high energy
Spectrometer Dipole In mapping laboratory Spectrometer magnet a custom built 5.75m steel dipole similar to those in LEP injection region Temperature regulated with dedicated water-cooling (limits temperature rise to 3-4 degrees during ramp) Local field measurements come from 4 NMR probes positioned on precision mounts
Magnet Mapping Campaigns In 1998-99, prior to installation, magnet ∫B.dl was mapped on precision test stand in lab under wide variety of excitation currents, temperatures etc Measurements made by moving arm carrying NMR probe for core field, Hall probe for end fields A second campaign in 2001-02 was conducted post-dismantling
Residuals of Mapping Model Develop model to relate measured ∫B.dl s with local readings from fixed NMRs. Account for temperature variations. Model shows excellent residuals (<10-5). Use to predict ∫B.dl during physics Required understanding of bending field integral achieved!
Synchrotron Radiation Protection Residual expansions (5.5 microns / o C) and movements followed by stretched wire sensors
Position Measurements xBPM ~(S1 – S3) – (S2 – S4) (S1 + S2 +S3+S4) Position measurements provided by conventional LEP elliptical BPMs Equipped with custom- designed readout electronics built on common amplifier chain for all 4 buttons. Stability under a variety of operating conditions verified in sequence of bench tests.
BPM Calibration Relative Gain Calibration:fix relative response of each BPM (+ cross-talk) from sequence of ‘bumps’ and rotations carried out at least once each spectrometer experiment Absolute gain scale: fix this to 5% by looking at change in bend angle as Eb is changed by known amount through RF frequency manipulations Resolution of triplet residual < 1 micron
Spectrometer Datasets Spectrometer high energy calibrations consisted of 17 single beam fills, distributed equally between e- and e+, each of which had: • Reference point at (known) low energy, eg. 50 GeV • High energy point, usually around 93 GeV Also several ‘low energy’ fills when several measurements were made in 41-61 GeV range. (Plus a few fills at intermediate energies, eg. 70 GeV)
Raw Spectrometer Results From observed change in bend angle, determine change in Eb between reference point & high energy. As reference point is well known through NMR model (reliable at ~50 GeV!), can determine difference between NMR model and spectrometer estimate at high energy. Significant negative offset…
Division into electron/positron fills Significant scatter in raw results. Much of this is associated with the difference between electron and positron results. Electron results ~30 MeV lower than positron results This behaviour arises from error in sawtooth correction
RF Sawtooth Local energy varies from mean because of synchrotron radiation and replenishment from RF system: the sawtooth Sawtooth correction needed to relate spectrometer measurement to RF model. Sawtooth modelled in dedicated program, with per beam accuracy of ~10 MeV This represents a ~20 MeV accuracy in e- vs e+… …but accuracy in mean result ~5 MeV
What do Error Bars Mean? ? Arise from spread in results from different BPMs. 9 combinations in total, 3 of which are of particular interest:
BPM Results: by combination Different combinations give significantly different estimates of energy. Size of effect varies fill to fill Outers estimate is systematically low, inners is high; span between the two At least 2 of these estimates wrong & consistently biased!
Triplet residual behaviour Fill 8443 Another way to study/quantify BPM systematic fill by fill: <TRS> = Triplet Residual Shift averaged over both arms BPMs calibrated at low energy; hence centred triplet residuals Increasing Triplet residuals observed to shift in both arms by a few microns. In this fill <TRS> = -3.2 microns Apparent (not real!) BPM motion. Cause unclear (beam size?) … Time, Beam size, Synchrotron radiation… Calibrate out effect by studying evolution of results with <TRS> over all fills for each BPM combination, & see which has least dependence
Results from Outers Plot outer results vs <TRS> Certainly not flat! (slope is 27 6 x 10⁻⁵ / micron) Error bars 17 x 10-5 : assigned from chi2 of fit (e+/e- splitting effect from error in RF sawtooth removed in fit & plot)
Results from Inners Slope 0 6 x 10⁻⁵ / micron Innersshow very little dependence on <TRS> Inners provide a less biased estimator of energy
Results by BPM Combination Span lies between outers & inners (slope 14 6 x 10⁻⁵ / micron) From fits can extrapolate back to situation of zero systematic: Offset = -6 15 x 10-5 Result identical for each combination!
Cross-check on low energy data Several experiments exist where several spectrometer measurements were made over 41-61 GeV interval. These allow us to define a reference point, as before, at, eg. 50 GeV, and then study spectrometer performance at another low energy point. The contrast to the high energy analysis is that here we know what true energy is! • Check our conclusions on BPM systematics • See whether spectrometer measures energy correctly
Low Energy Results Fits to low energy data give entirely consistent slopes! 22 3 x 10⁻⁵ /micron -4 3 x 10⁻⁵ /micron 9 3 x 10⁻⁵ /micron Also, spectrometer agrees well with true energy at <TRS>=0
Spectrometer Summary Result for Eb : Spec-NMR = -5 18 MeV evaluated at Eb≈ 92 GeV Error assignment (shown in terms of relative energy eg. (Spec – NMR )/ NMR Without TRS systematic maybe 10 MeV precision would have been possible? (Intermediate energy points also give result at Eb≈ 70 GeV: Spec-NMR = -1 10 MeV 75% correlated with 92 GeV result)
Energy Loss & Synchrotron Oscillations Synchrotron tune, Qs , is ratio of synchrotron oscillation frequency to revolution frequency. Depends on RF voltage, VRF, and energy loss per turn, U0: Qs2~ (1/Eb) (e2VRF2 – U02) U0 in turn depends Eb4. Hence fit of Qs vs VRF can be used to extract Eb!
Measurement Procedure: RF Calibration Total RF voltage scale not known a priori sufficiently well for Eb measurement. Therefore extract from data by performing RF scans at low, known energies, before moving to high energy point.
Refining the Qs vs Eb Model Naive expression for Qs vs Eb dependence inadequate for precision measurement: • Requires correction for precise spatial distribution of RF voltage – input from simulation (MAD program) • Good knowledge of magnetic bending radius, , required, as U0 ~ Eb4 / . Fix from global fit to all data. • Expression assumes only source of bending field, and of energy loss, is in dipoles themselves. This not true!
Other Sources of Energy Loss As do parasitic mode losses coming from impedance in vacuum chamber walls Off-centre trajectories in quads, and finite beam-size, need to be accounted for Other effects: correctors, closed orbit distortions etc These have a current dependence and can be fixed from experiment In total: 10-4 – 10-3 correction to U0 !
Qs fits to data Final Qs model fits data very well (Qs signal harder to measure at high energy → larger scatter) Extract Eb with typical precision of 30 MeV per experiment
Qs Results 6 measurements in all (5 at 80 GeV, 1 at 90 GeV) All give result in agreement with NMR model ! Additional error component in 2000 due to non-linear term arising from need to excite oscillations to high amplitude for signal to be seen Combine results taking account of correlations: Qs – NMR = -3 16 MeVat Eb = 85 GeV
Summary of Eb Measurements We have 3 independent tests of NMR model at high energy: • Flux Loop Continuum of correlated measurements 72-106 GeV Offset w.r.t. NMR -28 to -618 MeV • Spectrometer Main measurement at 92 GeV: -518 MeV (second 75% correlated measurement at 70 GeV -110 MeV) • Qs vs VRF Six measurements which give: -316 MeV at 85 GeV