Correlation and Simple Regression
Correlation and Simple Regression. relationships between variables. Correlation Analysis. Correlation Analysis is a group of statistical techniques used to measure the strength of the association between two variables. e.g. – hot weather and ice cream sales are correlated.


Correlation and Simple Regression
E N D
Presentation Transcript
Correlation and Simple Regression relationships between variables
Correlation Analysis • Correlation Analysis is a group of statistical techniques used to measure the strength of the association between two variables. • e.g. – hot weather and ice cream sales are correlated
Correlation Analysis A Scatter Diagramis a chart that portrays the relationship between two variables. The Dependent Variableis the variable being predicted or estimated. The Independent Variable provides the basis for estimation. It is the predictor variable.
The Coefficient of Correlation, Pearson’s r The characteristics of the coefficient of correlation are: • It requires interval-scaled or ratio-scaled data. • It can range from -1.00 to +1.00 • Values of -1.00 or +1.00 indicate perfect correlation. • Values close to 0.0 indicate weak correlation. • Negative values indicate an inverse relationship and positive values indicate a direct relationship.
Perfect Positive Correlation 10 9 8 7 6 5 4 3 2 1 0 Y 0 1 2 3 4 5 6 7 8 9 10 X
Perfect Negative Correlation 10 9 8 7 6 5 4 3 2 1 0 Y 0 1 2 3 4 5 6 7 8 9 10 X
Zero Correlation 10 9 8 7 6 5 4 3 2 1 0 Y 0 1 2 3 4 5 6 7 8 9 10 X
StrongPositiveCorrelation 10 9 8 7 6 5 4 3 2 1 0 Y 0 1 2 3 4 5 6 7 8 9 10 X
Pearson’s r -- the Coefficient of Correlation • The Coefficient of Correlation(r) is a measure of the strength of the linear relationship between two variables. • Summary of the strength and direction of the coefficient of correlation.
Formula for Pearson’s r We calculate the coefficient of correlation from the following formulas. Conceptual formula Computational formula
The Coefficient of Determination r2 • The coefficient of determination (r 2) is the proportion of the total variation in the dependent variable (Y) that is explained or accounted for by the variation in the independent variable (X).
Coefficientof Determination – r2 The features of the coefficient of determination are: • It is the square of the coefficient of correlation. • It ranges from 0 to 1. • It does not give any information on the direction of the relationship between the variablesi.e. it does not ‘imply causality’.
EXAMPLE 1 • Do you believe that there is a relationship between the number of pages in a textbook and its selling price? • Suppose you decide to find out by selecting a sample of eight textbooks currently on sale in the bookstore.
EXAMPLE 1 continued Book Page Price ($) Intro to History 500 84 Basic Algebra 700 75 Intro to Psyc 800 99 Intro to Sociology 600 72 Bus. Mgmt. 400 69 Intro to Biology 500 81 Fund. of Jazz 600 63 Princ. of Nursing 800 93
Example 1continued Book Pages Price ($) X Y XY X2 Y2 Intro to History 500 84 42,000 250,000 7,056 Basic Algebra 700 75 52,500 490,000 5,625 Intro to Psyc 800 99 79,200 640,000 9,801 Intro to Sociology 600 72 43,200 360,000 5,184 Bus. Mgmt 400 69 27,600 160,000 4,761 Intro to Biology 500 81 40,500 250,000 6,561 Fund. of Jazz 600 63 37,800 360,000 3,969 Princ. of Nursing 8009374,400640,0008,649 Total 4,900 636 397,200 3,150,000 51,606
EXAMPLE 1 continued • The correlation between the number of pages and the selling price of the book is 0.614 • This indicates a moderate association between the variables.
Calculate the Coefficient of Determination – r2 • r2 = 0.6142 = .3769 • 37.69% of the variance in price is accounted for by the relationship between the number of pages and the price. • Remember, r2 does not imply causality…
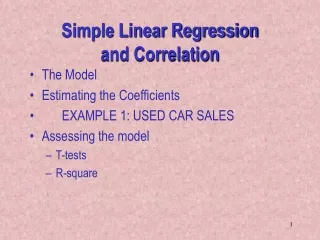
Regression Analysis using x to estimate y
Assumptions Underlying Linear Regression • For each value of X, there is a group of Y values. These Y values follow the normal distribution. • The meansof these normal distributions of Y values all lie on the straight line of regression. • The standard deviations of these normal distributions are equal. The best estimate we have of this common standard deviation is the standard error of estimate (Se). • The Y values are statistically independent. This means that in the selection of a sample, the Y values chosen for a particular X value do not depend on the Y values for any other X values.
Graphical Representation of the Assumptions underlying Linear Regression
Regression Analysis • In regression analysis we use the independent variable (X) to estimate the dependent variable (Y). • Enables us to find the direction of relationship, and the strength of relationship • Enables us to predict unobserved values of the dependent variable
Regression Equation • An equation that defines the linear relationship between two variables. • Y1 = a + bX • (Y1 is read Y prime)
Least Squares Principle • Determining a regression equation by minimizing the sum of the squares of the vertical distances between the actual Y values and the predicted values of Y.
Regression Analysis • The regression equation: Y1= a + bX, where: • Y1is the average predicted value of Y for any X. • a is the Y-intercept. It is the estimated Y value when X=0 • b is the slope of the line, or the average change in Y1for each change of one unit in X • the least squares principle is used to obtain a and b.
Applying the Least Squares Principle • The least squares principle is used to obtain • a and b. • The equations to determine a and b are: Slope of the regression line Y-intercept
EXAMPLE 2 • Develop a regression equation for the information given in EXAMPLE 1 that can be used to estimate the selling price based on the number of pages.
Example 2continued Book Pages Price ($) X Y XY X2 Y2 Intro to History 500 84 42,000 250,000 7,056 Basic Algebra 700 75 52,500 490,000 5,625 Intro to Psyc 800 99 79,200 640,000 9,801 Intro to Sociology 600 72 43,200 360,000 5,184 Bus. Mgmt 400 69 27,600 160,000 4,761 Intro to Biology 500 81 40,500 250,000 6,561 Fund. of Jazz 600 63 37,800 360,000 3,969 Princ. of Nursing 8009374,400640,0008,649 Total 4,900 636 397,200 3,150,000 51,606
Example 2continued • The regression equation is:Y1= 48.0 + .05143X • The equation crosses the Y-axis at $48. • A book with no pages would cost $48. • The slope of the line is .05143 • Each additional page costs about 5 cents.
Example 2 continued • We can use the regression equation to estimate values of Y. The estimated selling price of an 800 page book is $89.14, found by:
IS THE SAMPLE LARGE ENOUGH? • Because we are dealing with sample data, it is possible that the amount of association is due to chance. • Therefore, we test the hypothesis that there is no correlation in the population. • Use a .05 significance level. H0: The correlation in the population is zero. H1: The correlation in the population is not zero.
IS THE SAMLE LARGE ENOUGH? continued There are 6 degrees of freedom, found by n – 2 = 8 – 2 = 6. (its n – 2 because we lose 1 degree of freedom for X and 1 for Y) The decision rule is: H0 is rejected if t > 2.447 or if t < -2.447
IS THE SAMPLE LARGE ENOUGH? continued • To find the value of the test statistic we use: We fail to reject the H0. The amount of association could be due to chance.