Download

1 / 36
360 likes | 636 Vues
Dairy Marketing. Dr. Roger Ginder Econ 338 Fall 2009 Lecture #23. CLASS II PRICE – SKIM PORTION. Priced differently than skim for hard manufactured products Skim portion price announced in advance of the month where they apply—not during the month

E N D
Dairy Marketing Dr. Roger Ginder Econ 338 Fall 2009 Lecture #23
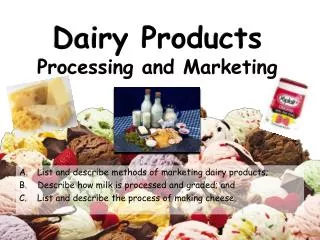
CLASS II PRICE – SKIM PORTION • Priced differently than skim for hard manufactured products • Skim portion price announced in advance of the month where they apply—not during the month • Announced Class II price for current month is known by the Friday on or before 23rd prior month • Based on same product formulas as Class IV and Class III skim But advanced two week pricing is used • Therefore PRICES used this in formula are different from Class III or Class IV skim Prices • Only the firsttwoweeks of NASS survey are used for Class II skim vs. four weeks of NASS survey in the case of Class III and IV skim
CLASS II MILK PRICE X 3.5 Butter Price f(B) Butter Fat Price/Lb. + $.007 Advanced 2 Week Class II Milk Price 2 Week Class II Skim Price+ 70 ¢ f(NDM) X 9.0 X .965 2 week NFDM Price Advanced NFDM Solids Price/Lb.
CLASS II PRICE – BUTTERFAT PORTION • Class II butterfat price per # is the Monthly Class III/IV butterfat price per # + constant differential of $.007 • Class II skim price now announced prior to the following month when it will apply • Friday in the preceding month on or before the 23rd • The butterfat portion is announced before the 5th of the current month and is same as class III/IV BF price
CALCULATION FOR CLASS II SKIM PRICING FACTOR Advanced nonfat solids price / lb. (NASS two week nonfat dry milk price - .137) / 1.02 Note: Same as formula Class IV nonfat solids but uses 2-week average for price 11A
CALCULATION OF CLASS II SKIM PRICING FACTOR • Next calculate advanced Class II skim price • Use advanced Class IV skim price • Add a fixed 70¢ /cwt Class II differential • (12A) Advanced Class IV skim milk price factor/cwt = • 9.0 x advanced nonfat solids price (13A) Class II skim price/cwt = advanced Class IV skim price + $.70
CLASS II MILK PRICE X 3.5 Butter Price f(B) Butter Fat Price/Lb. + $.007 Advanced 2 Week Class II Milk Price 2 Week Class II Skim Price+ 70 ¢ f(NDM) X 9.0 X .965 2 week NFDM Price Advanced NFDM Solids Price/Lb.
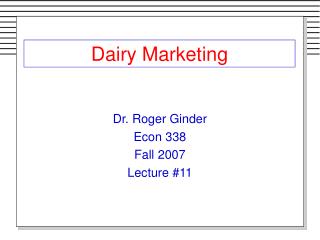
CALCULATION OF NONFAT SOLIDS PRICE/LB. • Market order pools are now calculated on a milk solids basis (rather than cwt of skim plus fat) • Class II handlers must account for # of nonfat solids to market order pool • Therefore must translate Class II skim price/cwt back to nonfat solids price/lb. • Class II nonfat solids price includes 70¢/differential • (14) Class II nonfat solids price/lb = (Class II skim milk • price/cwt including the 70¢ differential) 9.0
CALCULATION OF CLASS II PRICE/CWT • Butterfat for Class II is priced at the Monthly Class IV/III butterfat price plus a fixed Class II differential • (15) Class II butterfat price/lb. = • Class IV/III butterfat price + .007 • The .007 is 70¢ Class II differential 100 • Combining skim price and butterfat for Class II price/cwt: Class II price/cwt = • (16A) .965 x Class II advanced skim milk price/cwt + 3.5 • x Class II butterfat price/lb.
CLASS II MILK PRICE X 3.5 Butter Price f(B) Butter Fat Price/Lb. + .007 Advanced 2 Week Class II Milk Price 2 Week Class II Skim Price+ 70 ¢ f(NDM) X 9.0 X .965 2 week NFDM Price Advanced NFDM Solids Price/Lb.
CLASS I PRODUCT PRICING FACTOR • Both the Class I skim and Class I butterfat price are based on ADVANCED NASS two week prices • Class I products are based on eitherthe advanced Class III or the advanced Class IV price, whichever is higher • Thus, the Class I calculations must be made for both advanced Class III and advanced Class IV milk prices
ADVANCED CLASS I • Class IV advanced skim price as calculated for Class II using 2 week averages • Class III advanced skim price calculated using same formulas as Class III prices • BUT…Substitute in two week NASS average prices for four week averages in Class III
ADVANCED CLASS III SKIM MILK PRICING FACTOR Advanced butterfat price / lb. = (NASS 2-week Grade AA butter price – 0.114) 0.82 Advanced protein price / lb. = (NASS 2 week cheese price – .1702) x 1.405 + {[(NASS 2-week cheese price – 0.1702) x 1.582] – Advanced butter fat price} x 1.28 (19A) Advanced other solids price / lb. = NASS 2-week dry whey price – 0.137) .968 (17A) (18A)
(20A) Advanced skim milk price factor = 3.1 x advanced protein price + 5.9 x advanced other solids price The Class I skim milk price is the highest of either the Advanced Class III skim price Equation (20) or the Advanced Class IV skim price Equation (12a)
(21A) Class I skim milk price = Advanced Class III skim milk pricing factor or advanced Class IV skim milk pricing factor + the appropriate Class I differential (22A) Class I butterfat price/lb. = Advanced butterfat price + the appropriate (Class I differential 100) (23A) Class I price/cwt = .965 X the Class I skim price + 3.5 X the Class I butterfat price/lb.
Appropriate Class I differentials • No longer single basing point from Eau Claire • Specified for each county in market order • Generally increase from northwest – southeast • Under market order reform changed • East – little change in differentials • South Florida – increased (e.g., Tampa 17¢) • Upper Midwest – increased (e.g., Chicago 40¢ – Minneapolis 50¢) • Central – Very Little change for differentials in Central FMMO • Southwest decrease (e.g., Dallas 16¢ - Phoenix 17¢)
The Somatic Cell Adjustment • Applies to Class II & Class III & Class IV but not Class I fluid milk • Excluded Class I for several reasons • Possible reduction in shelf life – but there is no definitive data • High somatic cell count may increase rancidity/off flavor – but there is no definitive data • 70-80% of milk pooled goes to Class II, III and IV uses in some orders and if quality of that portion is adjusted adequate incentive exists • Price is adjusted for each 1,000 somatic cells in relation to a base level of 350,000 somatic cells • Positive adjustment for <350,000 somatic cells/liter • Negative adjustment for >350,000 somatic cells/liter • Amount of adjustment based on NASS price 40# block cheese
Calculating Somatic Cell Adjustments Assume: 1. SSC price adjuster of .0005 2. Average NASS 40# block price = $50.104 (1.2526/#) STEP 1 Calculate discount (premium) adjuster value per 1000 cells .0005 x $1.2526/lb = $.0006263 = .063 ¢ / 1000 cells Adjuster * NCE cheese per # = Premium (discount) per 1000 cells STEP II Calculate the dollar premium (discount) per cwt (a) If SSC tests 500,000 .063 (350-500) = -9.45 ¢ / cwt. Discount for excess cell count (b) If SSC tests 100,000 .063 (350-100) = +15.75 ¢/cwt Premium for lower cell count Premium (disc) / 1000 x (Standard - Actual) = Premium for low count SSC SSC
STEP III Calculate value of higher (lower) milk quality on revenue from volume marketed during the period 50 cows @ 16,000 #/cow If somatic cell count is 500000 or 150,000 SSC > Standard 350,000 (a) 8000 cwt. (-9.45 ¢) = ($756.00) of Milk Discount for Marketed Excess cells If Somatic cell count is 100,000 or 250,000 SSC < Standard 350,000 (b) 8000 (15.75 ¢ /cwt) = 1260.00 Absolute difference in revenue = $2016.00 on 8000 cwt. marketed
Revenue Difference on 200 Cow Herd @ 19,000#/Head (a) 38,000 cwt (-9.45 ¢/cwt) = ($3591) (b) 38,000 cwt (15.75 ¢ /cwt) = $5985 Absolute Revenue Diff = $9576
Calculating Class Prices for FMMOs Under New Component System - March Averages for NASS Survey Prices 2-Week Monthly (February) (March) Butter $0.9105 $0.9497 Cheese 1.1084 1.1093 Dry Whey 0.1800 0.1780 Nonfat Dry Milk 1.0104 1.0094
Advanced Prices Applying to Milk and Milk Components Under FMMO March (Reported February 18) Component/Class Price Eq. No. Equation Value Butterfat 17 (0.9105 – 0.114) : 0.82 $0.9713 Protein 18 (1.1084 – 0.1702) X 1.405 + {[(1.1084 – 0.1702) X 1.582] – 0.9713} X 1.28 1.9747 Other Solids 19 (0.1800 – 0.137) : 0.968 0.0444 Nonfat Milk Solids 11 (1.0104 – 0.137) 1.02 0.8563 Class IV Skim Milk Price Factor 12 9.0 X 0.8563 7.71 Class II Skim Milk 13 7.71 + 0.70 8.41 Class II Nonfat Solids 14 8.41 9.0 0.9344 Class III Skim Milk Price Factor 20 3.1 X 1.9747 + 5.9 X 0.0444 6.38 Class I Skim Milk (@ Base Zone) 21 7.71 + 1.80 9.51 Class I Butterfat (@ Base Zone) 22 0.9713 + (1.80 100) 0.9893 Class I @ Test (@ Base Zone) 23 (0.965 X 9.51) + (3.5 X .9893) 12.64
March Class III and Class IV Milk and Component Prices (Announced March )* With Class II Prices That Involved Butterfat Values Included Component/ Eq. Equation Value Class Price No. Butterfat 1 (0.9497 – 0.114) : 0.82 $1.0191 Protein 7 (1.1093 0.1702) X 1.405 + {[(1.1093 – 0.1702) X 1.582] – 1.0191} X 1.28 1.9166 Other Solids 6 (0.1780 – 0.137) : 0.968 0.0424 Nonfat Milk Solids 2 (1.0094 – 0.137) 1.02 0.8553 Class IV Skim Milk 3 9.0 X 0.8553 7.70 Class IV Milk @ Test 4 (3.5 X 1.0191) + (0.965 X 7.70) 11.00 Class III Skim Milk 8 (3.1 X 1.9166) + (5.9 X 0.0424) 6.19 Class III Milk @ Test 9 (3.5 X 1.0191) + (0.965 X 6.19) 9.54 Class II Butterfat Price 15 1.0191 + 0.007 1.0261 Class II Milk @ Test 16 (3.5 X 1.0261) + (0.965 X 8.41) 11.71
Location Adjustment • Difference in Class I differential at receiving plant and Class I differential at supply plant or at the farm
Pooling Process • Handlers account for their receipts by class • Handlers pay in or draw out of fund depending on difference between • Value of receipts priced at Marketing Order minimum prices • Average market wide value of all classes • Order minimum prices are established for four classes of milk Class I – Class IV
Pool Obligations of Handlers by Class* Milk Use Handler Obligation to the Producer Settlement Fund Class Class I • Class I Skim milk price at location x skim milk pounds • Class I Butterfat price at location x butterfat pounds Class II* • Class II Nonfat Solids price x nonfat solids pounds • Class II Butterfat price x butterfat pounds Class III* • Protein price x protein pounds • Other Solids price x other solids pounds • Butterfat price x butterfat pounds Class IV* • Nonfat Solids price x nonfat solids pounds • Butterfat price x butterfat pounds *Pool obligations in these classes are adjusted for somatic cell count of milk receipts.
Gross handler obligations are then reduced by several factors • Producer price differential (PPD) • Producer location adjustment • Protein value • Other solids value • Producer butterfat value • Somatic cell value • If results are positive, the handler pays that amount in • If results are negative, handler draws that amount out
Example Producer Settlement Fund • Handler I • Pool distributing plant • Packages beverage milk • Manufactures Class II products (soft) • Handler II • Pool supply plant • Ships 10% of milk to a pool distributing plant • Manufacturers cheese with 90% of milk • Assumptions for both • 1,000,000 pounds of milk processed • 3.7% butterfat • 3.1% protein • 5.9% other solids • No location or SSC adjustment
Partial Producer Settlement Fund Account with a Heavy Class I Handler Vs. Heavy Class III Handler (Av.Mkt.Val.=$106,024) Illustration of Producer Settlement Fund Accounting Rate per Handler 1 Handler 2 Pound Pounds Value Pounds Value Class I: Skim Milk $0.0951 770,400 73,265 96,300 9,158 Butterfat .9893 29,600 29,283 3,700 3,660 Class II: Nonfat Solids .9344 18,000 16,819 Butterfat 1.0261 7,400 7,593 Class III: Protein 1.9166 53,473 Other Solids .0424 2,251 Butterfat 1.0191 33,936 Class IV: Nonfat Solids .8553 Butterfat 1.0191 Total 126960 102478 Less: Prod. Price Differential .0064 1,000,000 6,400 1,000,000 6,400 Prod. Location Adj. --- Protein 1.9166 31,000 59,415 31,000 59,415 Other Solids .0424 59,000 2,502 59,000 2,502 Prod. Butterfat Value 1.0191 37,000 37,707 37,000 37,707 Somatic Cell Value --- NET TO/FROM FUND +20,936 -3,546
Producer Pricing • All producers receive same price for components • Payment based on cwt. of milk delivered • Payment differs based on three factors • Milk composition (quantity of components in it) • Quality of milk (somatic cells) • Location • Differences among producers on all three factors
Producer Price Differential • Actual amount that market-wide average value of receipts exceeds the value of components • Value of milk in excess of Class III component value in orders with MCP (seven of eleven orders) • PPD may be positive or negative • Positive if actual market-wide value > Class III value • Negative if actual market-wide value < Class III value
Producer Milk Check for 1,000 CWT of Milk Producer A Class I differential = 1.80/cwt Butterfat test 4.5% Percent protein 3.7% Other solids 6.0% Somatic cell count 110,000
Producer Milk Check for 1,000 CWT of Milk Producer B Class I differential = 1.60/cwt Butterfat test 3.3% Percent protein 2.8% Other solids 5.7% Somatic cell count 420,000
Milk Check Values Producer A Pricing Element Units Rate Value Producer Price Differential 1,000 Cwt. $0.64 $ 640 Protein 3,700 lbs. 1.9166 7,091 Other Solids 6,000 lbs. 0.0424 254 Butterfat 4,500 lbs. 1.0191 4,586 Somatic Cell Adjustment 1,000 Cwt. 0.13 130 TOTAL VALUE: 12,701 VALUE PER CWT. 12.70
Milk Check Values Producer B Pricing Element Units Rate Value Producer Price Differential 1,000 Cwt. $0.44 $ 440 Protein 2,800 lbs. 1.9166 5,366 Other Solids 5,700 lbs. 0.0424 242 Butterfat 3,300 lbs. 1.0191 3,363 Somatic Cell Adjustment 1,000 Cwt. (0.04) (40) TOTAL VALUE: 9,371 VALUE PER CWT. 9.37
Comparisons • Same rates of payment (prices) for component • Different quantities of components • Different locations • Producer B has fewer components than the standardized Class III cwt of milk • Therefore Producer B gets less than Class III price