Download
1 / 28
290 likes | 446 Vues
The CCWA manages the water supply for 260,000 residents, producing up to 39 million gallons of potable water daily. With a robust leak detection program initiated in 2000, aimed at reducing non-revenue water loss which was nearly 20%, the agency has successfully decreased it to 11% through innovative technologies. By surveying over 90% of the distribution system and using advanced leak detection equipment, CCWA has repaired 179 leaks from 2000 to 2004, recovering over 2 billion gallons of water, resulting in significant cost savings.

E N D
History of C.C.W.A. CCWA produces up to 39 million gallons a day of potable water. We have a potable water storage capacity of 35.6 million gallons stored in 10 ground and 8 elevated tanks. We also own and maintain 5 raw water reservoirs that provide raw water to 3 water production facilities. CCWA serves a population of 260,000 people through a system of distribution mains 1,265 miles long.
Size Total Footage 36” 8,100 30” 77,785 24” 170,020 20” 93,877 18” 270 16” 439,165 12” 552,580 10” 43,837 8” 1,878,707 6” 2,822,384 2” 592,208 1” 1,512 ¾” 945 Total footage in Clayton County is 6,681,087 Total miles of Water Main in Clayton County is 1,265’ Total footage surveyed in Clayton County is 4,805,312’ Total miles surveyed in Clayton County is 910 72% of our water system has been surveyed Water Lines in Clayton County
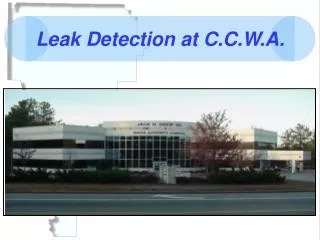
Leak Detection at CCWA The CCWA Board of Directors and Management Team began searching for ways to decrease our water loss. In March of 2000, Leak Detection was implemented.
March 2000 Non-revenue water loss was nearing 20% Leak Detection program Initiated Meter Testing Program expanded and placed under direction of the Maintenance and Construction Department October 2004 Non-revenue water loss is at 11% Non-Revenue Water Loss
Our Goal Our goal was to develop and maintain a comprehensive Leak Detection Program by surveying the entire Distribution System.
Starting a Leak Detection Crew We investigated and demonstrated several types of Leak Detection Equipment. After identifying the type of system we needed, our request was approved by the Clayton County Water Authority Board of Directors. We then started a Leak Detection Crew consisting of two people. We also added a Repair Crew made up of four people dedicated to repairing leaks that were found by the Leak Detection Crew.
Equipment Purchased • The system we purchased is the Flow Metrix Digicorr 98which has been upgraded to Digicorr III • Digital Correlating Loggers • Digitized map information (The entire county’s water system is in the Digicorr program) • Digital Filters • Leak Detection Equipment and Van cost was approximately $71,000.00
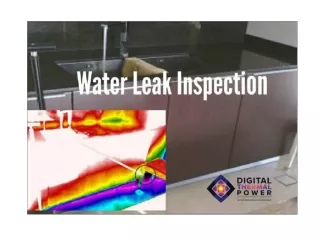
The Digital Difference Flow Metrix was able to create digital images of both area maps and detailed street plans used by the Clayton County Water Authority.
Getting Started • Connect both Field Sensing Units (FSU) to the Water Distribution System. • FSUs can be connected to meters, service lines, fire hydrants and valves. • Just make sure the connection is good and solid.
Programming the Computer 2. After everything is connected it is time to input the information in the computer. • Enter the pipe material and diameter. • Enter the distance between the sensors. • Then your ready to start correlation.
The Computer 3. Once the base and the FSU radios are linked, the correlation process will begin automatically. • The peak that develops in the correlation function indicates a leak. • It usually takes between 1-30 seconds for a peak to develop. Leak
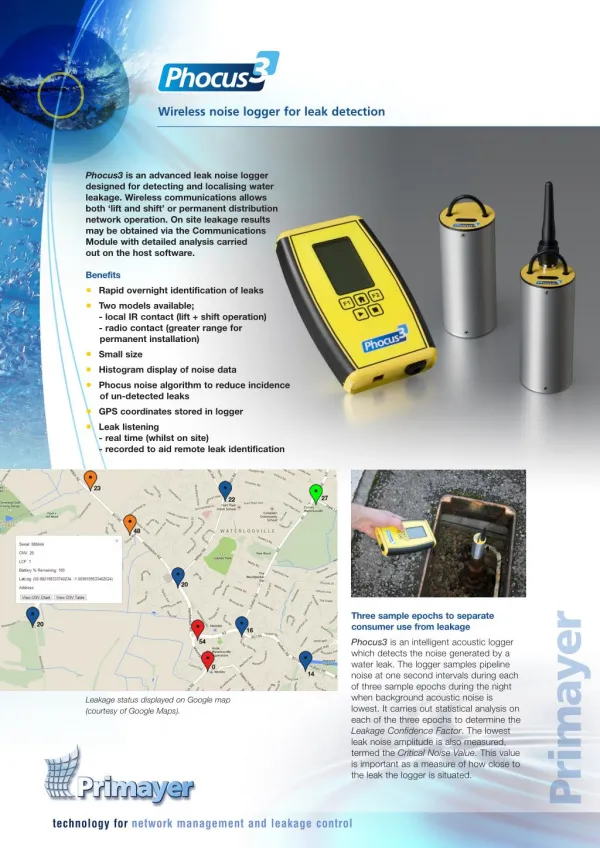
Programming Z-Corr • Pick an area for deployment • Program and place loggers on the map and print work order • Deploy
Deploying Z-Corr • Z-Corr is ideally deployed underground on a valve operating nut • However, it can also be mounted on any water system fitting
Picking up Z-Corr and Downloading Information • Once you pick up Z-Corr, place units back in docking station and download information • The computer automatically goes through all the loggers and finds possible correlations • Once a correlation has been detected enter the distance between loggers, pipe length and pipe diameter • The computer will then automatically give you a distance and location for the suspected leak
Formula to Determine Rates of Leakage Formula for Circular Orifice Q = 30.394 x A x P Formula for Other Opening Q = 22.796 x A x P A = Area of Opening in Square Inches P = Pressure (PSI) Q = Gallons Per Minute (GPM) • Some commonly used square roots 55 = 7.4 60 = 7.7 65 = 8.1 70 = 8.4 75 = 8.7 80 = 8.9 85 = 9.2 90 = 9.5 95 = 9.7 100 = 10.0 Example 6” Main with 1/8” wide beam break at 80 psi GPM = 30.394 x (3.14 x 6 x 1.25) x 80 30.394 x 2.35 x 8.94 = 638.5 gpm
Program to Date • Year # Leaks Discovered Gallons Recovered Production Cost • 2000 47 735,445,800 $1,220,840.03 • 2001 48 506,941,200 $927,702.40 • 2002 16 134,810,700 $338,374.86 • 2003 48 462,468,000 $1,114,547. 88 • 2004 26 237,308,400 $688,194.36 TOTALS March 2000 – October 2004 • 179 leaks discovered and repaired • 2, 076, 974, 100 gallons • $4, 289, 659. 53 in production cost saved
Production per Customer In 1999 we served 61,200 water customers (including accounts served by the City of Riverdale) and were producing/purchasing 10.5 billion gallons of potable water per year (171,568 gallons/customer/year). We currently serve 73,600 water customers and are producing/purchasing 9.9 billion gallons of potable water per year (134,510 gallons/customer/year). This programs success equates to a decreased production requirement of 5.8 MGD. That un-needed production is equal to over 50% of the capacity of our Freeman Road Water Production Facility and will delay Plant Expansions by several years.
Cost of Program • Total expended to date including Initial Investment, Hardware/Software Upgrade, Salaries, and Operating Expenses is $472,922.00. • Projected annual operating costs $96,229.00 • For every dollar expended we have recovered $9.07 in Production savings.
Leaks Found • We found a total of 179 leaks • 90 leaks on ¾” water service lines • 12 leaks on 1” water service lines • 50 leaks on 2” water mains • 19 leaks on 6” water mains • 5 leaks on 8” water mains • 1 leak on 10” water mains • 1 leak on 12” water mains • 1 leak on 16” water mains
Leaks Found 6” Beam Break = 160 GPM ¾”bypass on 8” Fire Line = 30 GPM
Leaks Found 6” Beam Break =508 GPM ¾” Galvanized Service Line = 9 GPM
Leaks Found ¾” Copper Service Line = 9 GPM 6” A.C. Pipe Split = 160 GPM
Conclusion The purpose of this presentation was to provide an information resource supporting the development of a Leak Detection Program and demonstrating the new technologies and management concepts to cost effectively reduce leakage to minimize your water/monetary losses. Please call Jeff Jones, CCWA Leak Detection Foreman, at 770-960-3612 for more information.