Download

1 / 39
400 likes | 692 Vues
Shaping Change: Dietary Guidelines and MyPlate. Cindy Wolff, MPA, PhD, RD Network for a Healthy California – Sierra Cascade Region Annual Face to Face Meeting July 19, 2011. Overview. MyPlate Dietary Guidelines MyPlate + Dietary Guidelines The new sodium guideline – we need help

E N D
Shaping Change: Dietary Guidelines and MyPlate Cindy Wolff, MPA, PhD, RD Network for a Healthy California – Sierra Cascade Region Annual Face to Face Meeting July 19, 2011
Overview • MyPlate • Dietary Guidelines • MyPlate + Dietary Guidelines • The new sodium guideline – we need help • How does the Rethink Your Drink message fit?
The Times They are A Changin’: USDA Guidelines • 1916 to 1930’s: • “Food for Young Children” and “How to Select Food” • Focus was on “protective foods” • 1940’s: A Guide to Good Eating • 7 food groups & number of servings needed • Lacked specific serving sizes
1956 to 1970s: A Daily Food Guide • 4 food groups and amounts from each group • No guidance on fats, sugars, and calories
1979: Hassle-Free Daily Food Guide • 5th group was added to the Basic Four to focus on the need to moderate fats, sweets, and alcohol
1984: Food Wheel: A Pattern for Daily Food Choices • Daily amounts of food for 3 calorie levels • 5 food groups and amounts formed the basis for the Food Guide Pyramid
1992: Food Guide Pyramid • Focused on variety, moderation, and proportion • Included visualization of added fats and sugars in 5 food groups and in the tip
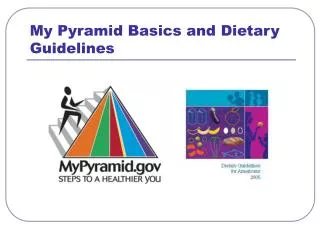
2005: MyPyramid • Daily amount of food at 12 calorie levels • Simplified illustration of “pyramid” concept • Added a band for oils and the concept of physical activity
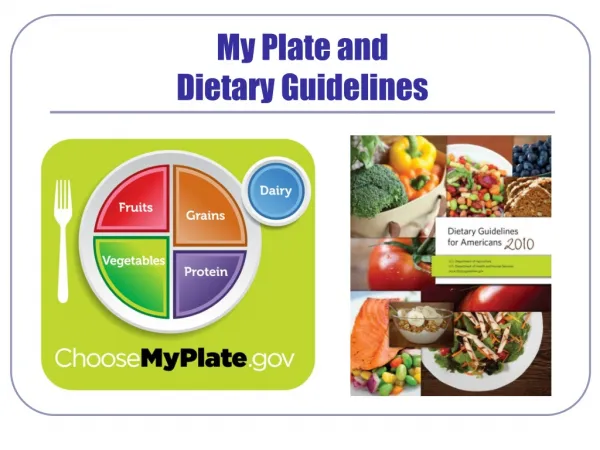
2011: MyPlate • Different shape to help • grab consumers’ attention • Focuses on healthy eating • Not intended to provide specific messages
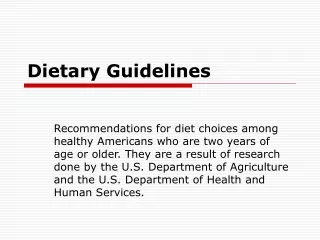
Dietary Guidelines • Established every 5 years starting in 1980. • Developed via coordinated efforts by: • Health and Human Service’s Office of Disease Prevention and Health Promotion • USDA’s Center for Nutrition Policy and Promotion • Agricultural research Services • 4. Independent Scientific Review Panel (2010)
1980 Dietary Guidelines • Eat a variety of foods • Maintain ideal weight • Avoid too much fat, saturated fat and cholesterol • Eat foods with adequate starch and fiber • Avoid too much sugar • Avoid too much sodium • If you drink alcohol, do so in moderation
1985 Dietary Guidelines Same as 1980 Guidelines except ideal weight is replaced with desirable weight.
1990 Dietary Guidelines • Changes from 1985 guidelines: • Maintain healthy weight • Choose a diet low in fat, saturated fat, and cholesterol • Choose a diet with plenty of vegetables, fruits, and grain products • Use sugar in moderation • Use salt and sodium in moderation
1995 Dietary Guidelines • Changes from 1990 guidelines: • Balance food with physical activity to maintain or improve your weight
2000 Dietary Guidelines • Changes from 1995 guidelines: • Aim for healthy weight • Keep food safe to eat
2005 Dietary Guidelines • Key Recommendations: • Adequate nutrients within calorie needs • Weight management • Physical activity • Food groups to encourage • Fats • Carbohydrates • Sodium and potassium • Alcoholic beverages • Food Safety
2010 Dietary Guidelines • Key Recommendations: • Balance calories to manage weight • Foods to reduce • Foods and nutrients to increase • Building healthy eating patterns
Dietary Guidelines & MyPlate How do we combine the 2 tools to convey a simple message?
Balancing Calories MyPlate • Enjoy your food, but eat less • Avoid oversized portions 2010 Guidelines • Select eating pattern to meet nutrient and calorie needs • Prevent/reduce overweight through improved eating and activity patterns • Increase physical activity and reduce sedentary behaviors • Assess how foods/beverages fit into a healthy pattern
Foods/Nutrients to Increase MyPlate • Make half your plate fruits and vegetables • Make at least half your grains whole grains • Switch to fat-free or 1% milk 2010 Guidelines • Increase fruits/vegetables • Half of grains as whole grains. • Increase fat-free/low-fat milk • Use oils to replace solid fats • Increase seafood • Reduce high fat protein foods • Choose foods rich in potassium, dietary fiber, calcium, and vitamin D
Foods/Nutrients to Reduce MyPlate • Compare sodium in foods like soup, bread, and frozen meals and choose foods with less sodium • Drink water instead of sugary drinks 2010 Guidelines • Reduce sodium to <2,300 mg • Reduce to <1,500 mg if: • 51 yrs. or older • African Am. of any age • Hypertension, diabetes, kidney disease • The 1,500 mg goal applies to 50% of U.S. population • Consume less than 300 mg per day of cholesterol
Foods/Nutrients to Reduce (cont.) 2010 Guidelines • <10% calories from sat. fat • Minimize trans fat • Reduce calories from sugars • Limit refined grains • If alcohol is consumed, consume in moderation: • ≤ 1 drink for women • ≤ 2 drinks for men
The Sodium Challenge: Motivation and Education Needed • Americans consumes approx. double recommendation • 1 in 10 adults meet their recommendation for sodium • 80% of sodium is from processed and restaurant foods • Sodium and calories increase and decrease together • We need help from the food industry
McDonald’s Menu Label Display • Calories are easily visible when placing an order • Nutrition menu available upon request • Sodium is listed for individual foods, not meals
Chipotle Nutrition Labeling • Calorie content is easy to see • A nutrition menu is available at the start of the line • Sodium is specific to each food or beverage
Olive Garden • Calories are the only nutrition info. on the menu • A nutrition menu is available upon request • Sodium is specified per food item
Choices: Worse vs. Less Worse • McDonalds: Hamburger, med. fries, coke = 800 mg Avoid angus bacon & cheese at 2070 mg • Chipotle: Rice, bean, meat, salsa, cheese burrito=1700 mg Avoid carnitas, pinto beans, chili salsa at ~= 500 mg each • Olive Garden: Linguine alla marinara = 900 mg Avoid Tour of Italy at 3,830 mg • Breadsticks =400 mg sodium • Salad with dressing = 1930 mg NOTE: These values are typical for restaurants.
Rethink Your Drink • Main contributors to weight gain: • 1st Chips • 2nd Potatoes, e.g. French fries • 3rd Sweetened beverages • 4th Red meat • Area children consume ~1.4 svg/day • Overweight consume >2/d • Goal: ≤ 3 svgs per week (AHA)
MyPlate + Guidelines RTYD • MyPlate: Drink water instead of sugary drinks • Dietary Guidelines: Assess how foods/beverages fit into a healthy pattern
CA Obesity Prevention Think Tank May 6, 2011 3 Priorities: • Decrease sugary beverage consumption • Increase physical activity • Increase consumption of healthier foods Need comprehensive policy/environmental strategies to change social norms and promote drinking water: • A counter-marketing campaign • State and local policies to decrease availability for sweetened beverages and increase access to water • Limit marketing to children • Provide nutrition education on sugar content of sugary drinks