Ch10 Nonparametric Tests
230 likes | 430 Vues
Ch10 Nonparametric Tests. Outline. Introduction The sign test Rank-sum tests Tests of randomness The Kolmogorov-Smirnov and Anderson-Darling Tests. Introduction.

Ch10 Nonparametric Tests
E N D
Presentation Transcript
Outline • Introduction • The sign test • Rank-sum tests • Tests of randomness • The Kolmogorov-Smirnov and Anderson-Darling Tests
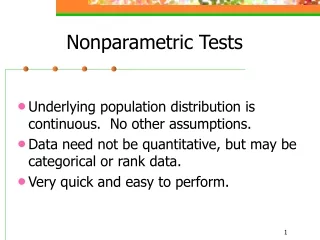
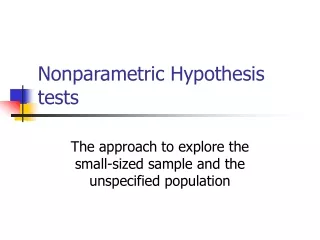
Introduction • Previous methods of inference that we have studied are based on the assumption that the observation come from normal population. • However, since there are many situation where it is doubtful whether the assumption of normality can be met. • Alternative techniques based on less stringent assumptions – nonparametric tests.
10.2 The sign test • The sign test: when we sample a continuous symmetrical population, the probability of getting a sample value less than the mean and the probability of getting a sample value greater than the mean are both ½. • We can formulate the hypotheses in terms of the population median.
Conducting a sign test • The following data constitute a random sample of 15 measurements of the octane rating a certain kind of gasoline: 99.0 102.3 99.8 100.5 99.7 96.2 99.1 102.5 103.3 97.4 100.4 98.9 98.3 98 101.6 Test the null hypothesis against the alternative hypothesis at the 0.01 level of significance.
Solution • 1. Null hypothesis: Alternative hypothesis 2. Level of significance: 0.01 • Criterion: based on the number of plus signs or the number of minus signs. Using the number of plus signs, denoted by x, reject the null hypothesis if the probability of getting x or more plus is less than or equal to 0.01.
Solution • Calculation: replacing each value greater than 98.0 with a plus sign and each value less than 98.0 with a minus sign, the 14 sample values yield • + + + + + - + + + - + + + + • Thus x=12, and from the binomial distribution of n=14, p=0.5, we get 5. Since 0.0065 is less than 0.01, the null hypothesis must be rejected. We conclude tha the median exceeds 98.0.
10.3 Rank-sum Tests • Rank sums: the U test and the H test. • The U test will be presented as a nonparametric alternative to the two-sample t test. • The H test will be presented as a nonparametric alternative to the one-way analysis of variance.
The U test • The U test (also called Wilcoxon test or the MannWhitney test) • Suppose in a study of sedimentary rocks, the following diameters (in millimeters) were obtained fro two kinds of sand: sand I: 0.63 0.17 0.35 0.49 0.18 0.43 0.12 0.20 0.47 1.36 0.51 0.45 0.84 0.32 0.40 sand II: 1.13 0.54 0.96 0.26 0.39 0.88 0.92 0.53 1.01 0.48 0.89 1.07 1.11 0.58 The problem is to decide whether the two populations are the same of if one is more likely to produce larger observations than the other.
Let X1 be a random variable having the first distribution and X2 be a random variable having the second distribution. Iffor all a, with strict inequality for some a, we say that the second population is stochastically larger than the first population. The U Test: ranking the data jointly, as if they comprise one sample, in an increasing order of magnitude, and for our data we get 0.12 0.17 0.18 0.20 0.26 0.32 0.35 0.39 0.40 0.43 I I I I II I I II I I 0.45 0.47 0.48 0.49 0.51 0.53 0.54 0.58 0.63 0.84 I I II I I II II II I I 0.88 0.89 0.92 0.96 1.01 1.07 1.11 1.13 1.36 II II II II II II II II I
The values of the first sample (Sand I): 1, 2, 3, 4, 6, 7, 9, 10,11,12,14,15,19,20, and 29. If there were tie among values, we would assign to each of the tied observations the mean of the ranks which they jointly occupy. For instance, the third and the fourth are identical, we would assign each the rank (3+4)/2 = 3.5. The sums of the ranks are Statistics:
Under the null hypothesis that the two samples come from identical populations, it can be shown that the mean and the variance of the sampling distribution of U1 are If there are ties in rank, these formulas provide only approximations, but if the number of ties is small, these approximations will generally be good. Is a random variable having approximately the standard normal distribution.
Solution of the example • Null hypothesis: Populations are identical. • Alternative hypothesis: The populations are not identical. 2. Level of significance: 0.01 3. Criterion: Reject the null hypothesis if Z<-2.575 or Z>2.575. 4. Calculations: since n1=15 and n2=14, we have 5. The null hypothesis must be rejected. There is a difference in the populations of grain size.
The H test (Kruskal-Wallis test) • The H test is a generalization of the U test in that it enables us to test the null hypothesis that k independent random samples come from identical populations. • If Ri is the sum of the ranks occupied by the ni observations of the i-th sample, and the test is based on the statistic When and the null hypothesis is true, the sampling distribution of the H statistic is well approximated by the chi-squaredistribution with k-1 degrees of freedom.
EX. • An experiment designed to compare three preventive methods against corrosion yielded the following maximum depths of pits in pieces of wire subjected to the respective treatments: Method A: 77 54 67 74 71 66 Method B: 60 41 59 65 62 64 52 Method C: 49 52 69 47 56 Use the 0.05 level of significance to test the null hypothesis that the three samples come from the identical populations.
Solution of the example • Null hypothesis: Populations are identical. • Alternative hypothesis: The populations are not identical. 2. Level of significance: 0.05 3. Criterion: Reject the null hypothesis if H>5.991 4. Calculations: 5. The null hypothesis must be rejected. 6. The P-value is 1-0.9649=0.0351 < 0.05
10.4 Tests of Randomness • Remind that in Ch6, we have discussed some assurance that a sample taken will be random. • Provide a technique for testing whether a sample may be looked upon as random after it has actually been obtained. • It is based on the number of runs exhibited in the sample results. EX. 8 runs TT HH TT HHH T HHH TTTT HHH
If a sequence contains n1 symbols of one kind and n2 of another kind (and neither n1 nor n2 is less than 10), the sampling distribution of the total number of runs, u, can be approximated closely by a normal distribution with Thus the test of the null hypothesis is that the arrangement of the symbols is random can be based on the statistic which has approximately the standard normal distribution.
EX • The following is the arrangement of defective, d, and nondefective, n, pieces produced in the given order by a certain machine: nnnnn dddd nnnnnnnnnn dd nn dddd Test for randomness at the 0.01 level of significance.
Solution of the example • Null hypothesis: Arrangement is random. • Alternative hypothesis: Arrangement is not random. 2. Level of significance: 0.01 3. Criterion: Reject the null hypothesis if Z<-2.575 or Z>2.575. 4. Calculations: since n1=10, n2=17, and u=6, we have 5. The null hypothesis must be rejected. The arrange is not random.
10.5 The Kolmogorov-Smirnov and Anderson-Darling Tests • The Kolmogorov-Smirnov tests are nonparametric tests for differences between cumulative distributions. The Kolmogorov-Smirnov one-sample test is generally more efficient than the chi-square tests for goodness of fit for small samples, and it can be used for very small samples where the chi-square test does not apply.
Solution of the example • Null hypothesis: • Alternative hypothesis: are not uniformly distributed. 2. Level of significance: 0.05 3. Criterion: Reject the null hypothesis if D>0.410, where D is the maximum difference between the empirical cumulative distribution and the cumulative distribution assumed under the null hypothesis. 4. Calculations: The difference is greatest at x=6.2 5. The null hypothesis cannot be rejected.
Anderson-Darling test • Difference in the tails can be easier to detect if the difference between the empirical cumulative distribution Fn and F is divided by. In particular it is based on the statistic or where