Nonparametric Tests
Nonparametric Tests. February 2013. Nonparametric Tests. Nature of the distribution is not known, or known to be non-normal. Sometimes called distribution free statistics Everything up to this point we’ve assumed comes from data that IS normally distributed. Nonparametric Tests.


Nonparametric Tests
E N D
Presentation Transcript
Nonparametric Tests February 2013
Nonparametric Tests Nature of the distribution is not known, or known to be non-normal. Sometimes called distribution free statistics Everything up to this point we’ve assumed comes from data that IS normally distributed.
Nonparametric Tests • Nonparametric tests use nominal and ordinal data • Nominal (presence or absence) • Pass or fail • Male or female • Presence or absence of a co-morbid disease in a clinical study • Taste (bitter, sweet or savory) • Ordinal (some level of ranking of nominal features) • Rating scales for pain • Clubbing continuous variables into groups, e.g. high, medium or low; young, middle aged, elderly; low income, moderate income, high income. • Number of bouts with asthma in a week
Nonparametric Tests • Sign test • Test for equal medians between two groups • Can be used on all data but more common in ordinal data • Simple: counts the number of times the median is either (+) higher or (-) in one group compared to another • If +’s and –’s occur with equal frequency then we know the medians are the same. • Use a Z statistic for the proportion equal to 0.5 to test for differences between the two groups. • Does not account for how large or small the differences in medians may be. • NOTE: Does not require a normal distribution – and is basically just like the parametric t-test. In fact, if the t-test is the appropriate test, but you have non-normal data, that is when you use the Sign Test.
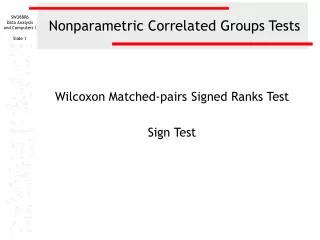
Nonparametric Tests • Wilcoxon Signed Rank Test • Test for equal medians between two groups BUT in this case it takes into account the magnitude of the difference between the paired results (how much bigger the median is for one group than the other, not just if it is the same, higher or lower) • Uses paired data • Wilcoxon Rank Sum Test • Tests for differences between two independent groups • Kruskal-Wallis Test • One-way ANOVA for nonparametric data
Nonparametric Tests • What you need to know: • use the appropriate statistic for your data. Never try to dumb your data down to use a lower level statistic unless there are problems that you can’t overcome with distributions, etc. • Studies must be sure to use non-parametric tests when the data do not support more quantitative analyses. • Know that these non-parametric alternatives exist.
Chi-Square Probably the most commonly used and easiest to understand and one of the only nonparametric tests that reveals association between variables.
Chi-Square Statistic Uses categorical data which can be presented in tabular fashion, e.g., rows and columns. The chi-square statistic compares the observed count in each cell of the table with what would be expected if there is no association between the rows and columns in the table. Used to test the hypothesis of no association between two (or more) groups and compares observed to expected counts.
Example: Is getting the flu associated with receiving a flu shot? • The relationship between getting the flu and receiving a flu shot can be displayed in a contingency table. • From the table we can see • 86/99 = 87% of those who got a shot did not get the flu • 80/93 = 86% of those who got the flu did NOT get a shot got the flu • Does this suggest an association between the flu shot and getting the flu?
Example: This is a test of no association. • The question of interest: does the flu shot decrease your likelihood of getting the flu? • Need to calculate the numbers of shot/no shot individuals that would be expected if the probability of getting the flu were the same for each group. • If there is no association between having a shot and getting the flu then the expected counts should nearly equal the observed counts – and the X2 square value should be small.
Example: This is a test of no association. • In our example: • Overall proportion getting the flu shot = 99 / 214 = 0.463 • Overall proportion not getting the shot was 115 / 214 = 0.537 • The observed numbers or counts in the table:
Example: This is a test of no association. • Under the assumption of no association between getting the flu shot and getting the flu, the expected numbers or counts in the table would be: (Note: Expected counts = row total X column total / total number)
Chi-Square Statistic X2 = Sumi[(Observedi – Expectedi) 2 / Expectedi] X2 =(13 – 43)2 /43 + (86-56)2 /56 + (80-50)2 / 50 + (35-65)2 / 65 = 900/43 + 900/56 + 900/50 +900/65 =20.93 +16.07 +18.00 +13.85 = 68.85
Chi-Square Statistic • X2calculated = 68.85 • We have made the assumption for our test that there is no association between flu shots and getting the flu. • A small value for chi-square would support this assumption: why? • A large value would not support this assumption: why? • The question would be, is this a statistically significant result? • So, just like the t-test, we go to the tables
Chi-Square Statistic X2calculated = 68.85 X2table= 3.84 with 1 degree of freedom (d.f. = (rows -1) times (columns-1) and alpha =0.05 Therefore, we reject the hypothesis of no association and can state the p-value would be less than 0.05 (would need to look up in the table to obtain the actual p-value)
Recap: Common Statistical Tests • T-tests • One sample and two sample (paired and independent) • Useful for comparing the means of two groups • Can be used for more groups but you run the risk of making a Type I error. • Analysis of Variance • Compares two or more means controlling for the experiment-wise (Type I error) • Correlation and Regression • Compares multiple data points and provides the ability to predict values of the dependent variables • Chi-square • Useful in helping determine association between variables. Not causal, just if there is any association.