Download

1 / 71
710 likes | 858 Vues
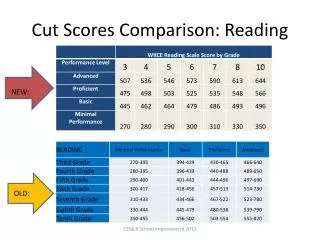
New MEAP and MME Cut Scores, In Depth. Presentation at the Fall 2011 Meeting of the Michigan Educational Research Association. Study 1. Identifying MME Cut Scores. Data Sources: College Grades. College Courses Included. Grades Used in the Analyses.

E N D
New MEAP and MME Cut Scores, In Depth Presentation at the Fall 2011 Meeting of the Michigan Educational Research Association
Study 1 Identifying MME Cut Scores
Grades Used in the Analyses • Grades were put on a numeric scale from 0-4 • 0 = F • 1 = D • 2 = C • 3 = B • 4 = A • Not used • AU, AWF, DR, R, RA, FR, T, TR, X • Coded as 3.0 • P, CR • Coded as 0.0 • IN, N, NC, NE, NS, W, WF, WP, WX, and U
Analyses Conducted to Identify MME Cut Scores • Students receiving an A • Students receiving a B or better • Students receiving a C or better • Students receiving a B or better in 4-year universities • Students receiving a B or better in 2-year institutions
Analyses Conducted to Identify MME Cut Scores • Logistic Regression (LR) • Identify score that gives a 50% probability of achieving an A • Identify score that gives a 50% probability of achieving a B or better • Identify score that gives a 50% probability of achieving a C or better • Signal Detection Theory (SDT) • Identify scores that maximize the proportion receiving consistent classifications from MME to college grades • i.e., both proficient/advanced and receiving a A/B/C or better • i.e., both not proficient/partially proficient and receiving a A-/B-/C- or worse • Equivalent to LR under mild monotonicity assumptions • Selected SDT as the preferred method because of its purpose (maximizing consistent classification)
Logistic Regression, Mathematically • Where • success is obtaining an A/B/C or better • e is the base of the natural logarithm • β0 is the intercept of the logistic regression • β1 is the slope of the logistic regression • x is the MME score
How Signal Detection Theory Works in Identifying MME Cut Scores • Basic Idea • Set the MME cut score to… • Maximize the number of students in the Consistent cells • Minimize the number of students in the Inconsistent cells • Maximize consistent classification from MME to first-year college grades
How Signal Detection Theory Works in Identifying MME Cut Scores
How Signal Detection Theory Works in Identifying MME Cut Scores
How Signal Detection Theory Works in Identifying MME Cut Scores Adjust the unknown cut score to maximize consistent classification
How Signal Detection Theory Works in Identifying MME Cut Scores
How Signal Detection Theory Works in Identifying MME Cut Scores
Results of Study to Identify MME Cut Scores • Analyses treating grades of A as the success criterion produced unusable results (i.e., the highest possible MME scale scores • Analyses treating grades of C as the success criterion produced unusable results (i.e., MME scale scores below chance level) • Analyses treating 4-year and 2-year institutions did produce different cut scores, but they were within measurement error of each other • Used analyses based on all institutions and grades of B or better to produce MME cut scores • Used probability of success of 33% and 67% to set the “partially proficient” and “advanced” cut scores • SDT and LR produced very similar results • Used SDT because it was the preferred methodology
Study 2 Identifying MEAP Cut Scores
Analyses Conducted to Identify MEAP Cut Scores • Logistic Regression (LR) • Identify score that gives a 50% probability of achieving proficiency on a later-grade test (i.e., MME or MEAP) • Signal Detection Theory (SDT) • Identify scores that maximize the proportion receiving consistent classifications from one grade to a later grade • i.e., proficient/advanced on both tests • i.e., not proficient/partially proficient on both tests • Equivalent to LR under mild monotonicity assumptions • Equipercentile Cohort Matching (ECM) • Identify scores that give the same percentage of students proficient/advanced on both tests • Selected SDT as the preferred method because of its purpose (maximizing consistent classification) • However, SDT and LR are susceptible to regression away from the mean
How Logistic Regression Works in Identifying MEAP Cut Scores • Same as for identifying MME cut scores • Criterion for success is proficiency on a later grade test rather than getting a B or better in a related college course
How Signal Detection Theory Works in Identifying MEAP Cut Scores Each dot represents a plot of test scores in grade 8 and grade 11 for a single student
How Signal Detection Theory Works in Identifying MEAP Cut Scores Grade 11: Not proficient Grade 11: Proficient
How Signal Detection Theory Works in Identifying MEAP Cut Scores Grade 8: Proficient Grade 11: Not proficient Grade 8: Proficient Grade 11: Proficient Grade 8: Not proficient Grade 11: Not proficient Grade 8: Not Proficient Grade 11: Proficient
How Signal Detection Theory Works in Identifying MEAP Cut Scores
How Signal Detection Theory Works in Identifying MEAP Cut Scores
Addressing Regression Effects • The more links in the chain, the greater the effects of regression • Original plan for Math and Reading • Link grade 11 MME to college grades • Link grade 8 MEAP to grade 11 MME • Link grade 7 MEAP to grade 8 MEAP • Link grade 6 MEAP to grade 7 MEAP • Link grade 5 MEAP to grade 6 MEAP • Link grade 4 MEAP to grade 5 MEAP • Link grade 3 MEAP to grade 4 MEAP • Original plan results in 7 links by the time the grade 3 cut is set • Original plan results in inflated cut scores in lower grades
Addressing Regression Effects • Revised plan for Math and Reading • For Grade 3, 4, 5, 6 • Link grade 11 MME to college grades • Link grade 7 MEAP to grade 11 MME • Link grade 3, 4, 5, or 6 MEAP to grade 7 MME • For Grade 7, 8 • Link grade 11 MME to college grades • Link grade 7 or 8 MEAP to grade 11 MME • Results in a maximum of three links for any one grade
Results • No evidence of regression away from the mean in identifying MEAP “proficient” cut scores • Looking for a consistently lower percentage of students proficient as one goes down in grades • Used SDT to identify MEAP “proficient” cut scores • Evidence of regression away from the mean in identifying MEAP “partially proficient” and “advanced” cut scores • Increasingly smaller percentages of students in the “Not proficient” and “Advanced” categories as one goes down in grade • Used ECM instead to identify MEAP “Not Proficient” and “Advanced” cut scores
Results • No evidence of regression away from the mean in identifying MEAP “proficient” cut scores • Looking for a consistently lower percentage of students proficient as one goes down in grades • Used SDT to identify MEAP “proficient” cut scores • Evidence of regression away from the mean in identifying MEAP “partially proficient” and “advanced” cut scores • Increasingly smaller percentages of students in the “Not proficient” and “Advanced” categories as one goes down in grade • Used ECM instead to identify MEAP “Not Proficient” and “Advanced” cut scores
Results: Classification Consistency Rates • Classification Consistency Rates for MEAP Cut Scores in Mathematics
Results: Classification Consistency Rates • Classification Consistency Rates for MEAP Cut Scores in Reading
Results: Classification Consistency Rates • Classification Consistency Rates for MEAP Cut Scores in Science
Results: Classification Consistency Rates • Classification Consistency Rates for MEAP Cut Scores in Science
Study 3 Creating Mini-Cuts for PLC Calculations in Reading and Mathematics
Identify Mini-Cut Scores Such That The Mini-Categories Are Larger than the CSEM across the Mini-Categories
Impact Data, Mathematics New Versus Old Cut Scores