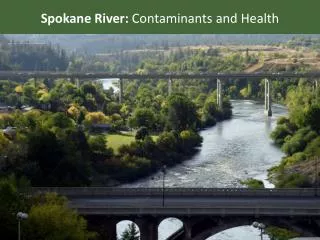
Spokane River PCB Source Assessment
Spokane River PCB Source Assessment. Washington State Department of Ecology Spokane River Forum May 24 2011. Spokane River Total PCBs in Fish Tissue 1993-1999. Max. Mean. Min. WA Standard= 5.3 ng/g. ng/g= parts per billion. Components of Spokane River PCB Source Assessment .

Spokane River PCB Source Assessment
E N D
Presentation Transcript
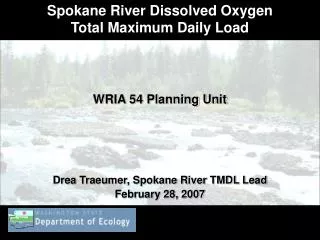
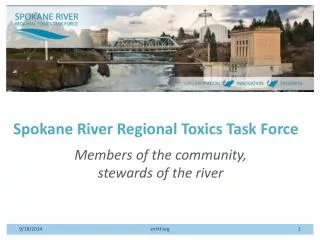
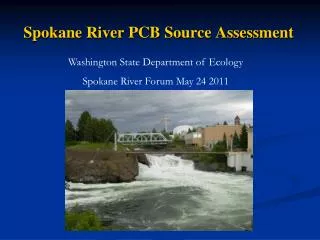
Spokane River PCB Source Assessment Washington State Department of Ecology Spokane River Forum May 24 2011
Spokane River Total PCBs in Fish Tissue1993-1999 Max Mean Min • WA Standard= 5.3 ng/g ng/g= parts per billion
Components of Spokane River PCB Source Assessment Source Assessment 2003-2004 Fish Tissue Advisory Update 2005 City of Spokane Stormwater 2007
Sampling Overview Sampling conducted between 2003 - 2007 • River water (2003-04) • Industrial and municipal discharges (2003-04) • Storm water (2007) • Bottom sediments and sediment cores (2003-04) • Suspended particulates (2003-04) • Resident fish (2005) Rainbow and Brown Trout, Mountain Whitefish, Smallmouth Bass, Largescale and Bridgelip Sucker
Study Area RM 112 RM 0
Historic PCB Effluent Loading Data1994-2002 -=Not measured milligrams/day
Comparison of WWTP Effluent Concentrations of PCBs in Washington pg/l= parts per quadrillion
PCB Loads from City of Spokane Storm Drains Total PCB Load= 690 mg/day
Idaho Stateline (RM 96.1) 477 Washington Liberty Lake WWTP= 2.9 Inland Empire= 45 Kaiser= 65= 65 354 (mid) 721 (bottom) Upriver Dam (RM 80.2) Monroe Street Upper Falls Dam (RM 74.5) City of Spokane Stormwater= 690 1,413 Spokane WWTP= 194 2,281 Ninemile Dam (RM 58.1) Little Spokane River= 97 Long Lake Dam (RM 33.9) 3,664 PCB Loading in Spokane River2003-2004 Total PCBs, mg/day Flow
Dissolved PCBs in Mainstem2003-2004 pg/l= parts per quadrillion
Reductions Needed In Spokane River to Meet Water Quality Standards
Total PCBs in Spokane River Sediments ng/g, OC= parts per billion organic carbon normalized
Sediment Effects at Upriver Dam2003-2004 Dissolved Total PCBs in Surface Water pg/l= parts per quadrillion
Sediment Profile for LowerLake Spokane • Steep declines from 1960s through mid-1980s • Concentrations have decreased by about ½ since mid- 1980s ng/g= parts per billion
PCBs in Spokane River Fish2005 Sportfish Fillets Whole Suckers Highest Levels near Mission Park ug/kg= parts per billion
Conclusions • PCB levels in Spokane River have declined since 1990s but are still above standards and elevated compared to most other areas of Washington • PCB concentrations in water increase moving downstream from the Idaho border to Lake Spokane • The largest PCB loading to the river appears to be from storm water in the City of Spokane • To meet the Spokane Tribe water quality standard, all sources (including the river at the Idaho Border and sediments) will have to be reduced by at least 95%
Recommendations Implement Spokane River Toxics Reduction Strategy Prevention, management and cleanup Conduct upstream source tracing within conveyance systems Urban Waters Initiative Conduct effectiveness monitoring to track progress in reducing PCB levels Draft plan scheduled for early 2012
Links • Spokane River PCB Source Assessment 2003-2007 http://www.ecy.wa.gov/biblio/1103013.html • Spokane River Toxics Reduction Strategy http://www.ecy.wa.gov/biblio/1110038.html