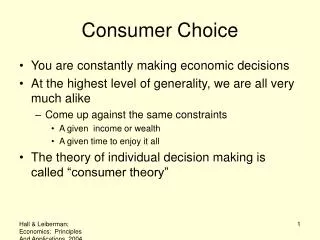
Consumer Choice
Consumer Choice. Number of Movies per Month. With $150 per month, Max can afford 15 movies and no concerts,. 15. 12 movies and 1 concert or any other combination on the budget line. 12. Points below the line are also affordable. C. 9. D. 6. But not points above the line. E. 3.


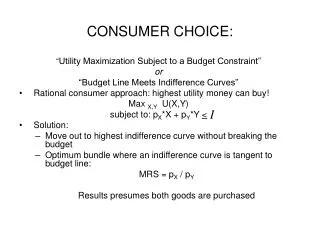
Consumer Choice
E N D
Presentation Transcript
Number of Movies per Month With $150 per month, Max can afford 15 movies and no concerts, . . . 15 12 movies and 1 concert or any other combination on the budget line. 12 Points belowthe line are also affordable. C 9 D 6 But not points above the line. E 3 F Number of Concerts per Month 1 2 3 4 5 Figure 1 The Budget Constraint A B H G
(a) Number of Movies per Month 1. An increase in incomeshifts the budget line rightward, with no change in slope. 30 15 Number of Concerts per Month 5 10 15 Figure 2 Changes in the Budget Line
(b) Number of Movies per Month 2. A decrease in the price ofmoviesrotates thebudget line upward. 30 15 Number of Concerts per Month 5 15 Figure 2 Changes in the Budget Line
(c) Number of Movies per Month 3. while a decrease in the price of concerts rotates it rightward. 30 15 Number of Concerts per Month 5 15 Figure 2 Changes in the Budget Line
Utils 70 60 50 40 1. The change in total utility from one more ice cream cone . . . 30 20 10 1 2 3 4 5 6 Ice Cream Cones per Week 3. Marginal utility falls as more cones are consumed. 2. is called the marginal utility of an additional cone. Utils 30 20 10 2 1 3 4 5 6 Ice Cream Cones per Week Figure 3 Total and Marginal Utility Total Utility Marginal Utility
Number of Movies per Month A 15 B 12 C 9 D 6 E 3 F Number of Concerts per Month 5 1 2 3 4 Figure 4 Consumer Decision Making G
30 2. If his preferences are as given in the table, he'll choose point H Number of Movies per Month 27 1. When Max's income rises to $300, his budget line shifts outward. A 15 B 3.But different marginal utility numbers could lead him to H' or H'' 12 H C 9 D 6 E 3 F 1 2 3 4 5 6 7 8 9 10 Number of Concerts per Month Figure 5 Effects of an Increase in Income H'' H'
1. When the price of concerts is $30, point D is best for Max. 2. If the price falls to $10, Max's budget line rotates rightward, and he choose point J. 15 Number of Movies per Month K 10 8 3. And if the price drops to $5, he chooses point K. 6 0 3 5 7 10 15 30 4. The demand curve shows the quantity Max chooses at each price. Figure 6 Deriving the Demand Curve J D Price per Concert $30 D J 10 K 5 3 7 10 Number of Concerts per Month
Ultimate Effect (Almost Always) Figure 7 Income and Substitution Effects Price Decrease: Substitution Effect P QD Þ QD QD if normal Purchasing Power QD if inferior Price Increase: Substitution Effect P QD Þ QD QD if normal Purchasing Power QD if inferior
Jerry George Elaine Price Price Price $4 $4 $4 3 3 3 2 2 2 1 1 1 0 4 12 0 6 12 0 10 20 Figure 8 From Individual to Market Demand (a) = + + c C' C'' Number of Bottles per Week
Price $4 Market Demand Curve 3 2 1 3 10 27 44 Number of Bottles per Week Figure 8 From Individual to Market Demand (b) A B C D E
(a) (b) Economics Score Economics Score 90 90 80 80 70 75 80 70 75 80 90 French Score French Score Figure 9 Time Allocation F E D C C
1. If Max gets another concert… Number of Movies per Month 20 G 2. he could give up 9 movies and be just as satisfied. 3. For Max, points G and H are on the same indifference curve. +1 11 H -5 +1 -2 6 J 4 -1 K 3 L Number of Concerts per Month 1 2 3 4 5 4. The indifference curve gets flatter moving rightward and downward along the curve. Figure A.1 An Indifference Curve +1 -9 +1
1. Max prefers any point on this indifference curve…. Number of Movies per Month 3. And any point on this curve is preferred to any point on the other two. 2. to any point on this one Number of Concerts per Month Figure A.2 An Indifference Map 20 G R 11 H S J 6 1 2 3
Number of Movies per Month 15 2. but point D--on a higher indifference curve--is preferred. 12 1. Points B and E are affordable. 9 3. At Max's best possible point, the budget line and indifference curve are tangent. 6 3 Number of Concerts per Month 1 2 3 4 5 Figure A.3 Consumer Decision Making with Indifference Curves A B D E
30 1. When Max's income rises to $300, his budget line shifts outward. Number of Movies per Month 2. If his preferences are shown by these two indifference curves, he'll choose point H. 15 3. But different preferences could lead him to H'' or H'. Number of Concerts per Month 5 10 Figure A.4 An Increase in Income H'' H 12 6 D H' 3 6
1. When the price of concerts was $30, at point D. 2. But when the price of concerts falls to $10, their condition is satisfied at point J. 3. The demand curve shows the quantity of concerts Max chooses at each price for concerts. Figure A.5 Deriving the Demand Curve (a) 15 Number of Movies per Month K 10 8 J D 6 1 2 3 4 5 6 7 10 15 30 Number of Concerts per Month D (b) $30 Price per Concert 25 20 15 J 10 K 5 1 2 3 4 5 6 7 10 Number of Concerts per Month