Understanding Quadratic Functions: Graphing, Vertex, and Properties
This resource provides an in-depth exploration of quadratic functions, commonly represented as second-order polynomials. It covers essential concepts such as graphing parabolas, understanding the vertex, and determining the axis of symmetry. Students will learn that quadratic functions can stretch or flatten based on the leading coefficient and how constants shift the graph vertically. Key definitions and fundamental rules are outlined, along with practical graphing techniques including T-tables. Engage with examples and a homework section to reinforce your understanding.

Understanding Quadratic Functions: Graphing, Vertex, and Properties
E N D
Presentation Transcript
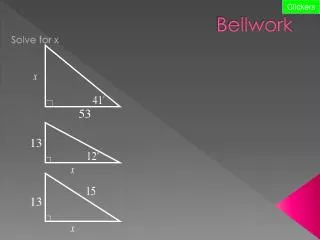
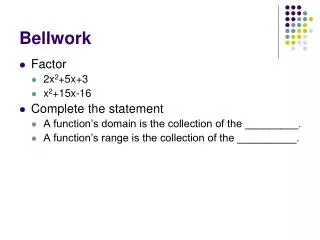
Bellwork • Factor • 2x2+5x+3 • x2+15x-16 • Complete the statement • A function’s domain is the collection of the _________. • A function’s range is the collection of the __________.
Bellwork Solution • Factor • 2x2+5x+3 • x2+15x-16
Bellwork Solution • Factor • x2+15x-16
Bellwork Solution • Complete the statement • A function’s domain is the collection of the _________. • A function’s range is the collection of the __________. Inputs or x’s Outputs or y’s
Graph y=ax2+c Section 10.1
The Concept • In chapter 9 we worked with second order polynomials. • In chapter 10 we actually graph these functions and use the for analysis
Definitions • A second order polynomial’s graph is what is called a parabola • Thus these functions are sometimes called parabolic functions • Another term that is used is a quadratic function. • They look like this Interesting fact: Satellite dishes are parabolic in form because of the special properties attributed to these “conic sections”
Definitions • Much like linear functions, these functions come with their own nomenclature • Two important terms • Vertex: Highest or lowest point of a quadratic • Axis of symmetry: Imaginary line that divides the parabola into two mirrored halves Axis of symmetry Vertex
More terminology • These terms are important because they’re used to describe different parabolas, much like slope was used for lines • As well, they are used to describe changes made to the parent function • A parent function is a standard graph for a basic function • This graph is the parent function for a quadratic
Y X Graphing • At this point, graphing these function is best done via T-table x y=x2 1 1 2 4 3 9 -1 1 -2 4 -3 9
Y X Graphing • We can also plot several iterations to see the effect of a scalar (or leading coefficient) attached to the term • This scalar makes the equation y=ax2 x y=x2 y=2x2 y=1/2x2 1 1 2 .5 2 4 8 2 3 9 18 4.5 -1 1 2 .5 -2 4 8 2 -3 9 18 4.5
Y X Graphing • These graphs lead us to understand a fundamental of graphing • If a>1, the graph stretches • If a<1, the graph flattens
Y X Graphing • Let’s look at what happens when a<0 x y=x2 y=-x2 1 1 -1 2 4 -4 3 9 -9 -1 1 -1 -2 4 -4 -3 9 -9 Therefore we see that if a<0, the graph is mirrored over the x-axis
Fundamental Rules • At this point we see some fundamental rules of quadratics • If the leading coefficient is positive (a>0) • Concave up (cupped upwards) • If the leading coefficient is negative (a<0) • Concave down (cupped downwards)
Y X Graphing • Let’s look at one last thing • What do you think happens when we add a constant? x y=x2 y=x2+2 y=x2-3 1 1 3 -2 2 4 6 1 3 9 11 6 -1 1 3 -2 -2 4 6 1 -3 9 11 6 Therefore we see that the constant dictates the height of the function on the y-axis
Fundamental Rules • At this point we see some fundamental rules of quadratics • If the leading coefficient is positive (a>0) • Concave up (cupped upwards) • If the leading coefficient is negative (a<0) • Concave down (cupped downwards) • A constant added indicates the y-coordinate of the vertex
Homework • 10.1 • 1-5, 7-23 odd, 33-36
Y X Example • Graph
Most Important Points • A second order polynomial can be called a quadratic function • It’s graph is called a parabola • Parabola’s have a vertex and axis of symmetry • Leading coefficients either flatten or stretch graphs • Negative leading coefficients cause the graph to be mirrored across the x-axis • A constant indicates the vertex’s y-coordinate