Download
1 / 15
150 likes | 274 Vues
The Virtual Radiation Belt Observatory (ViRBO) enhances the search, access, and visualization of radiation belt data. It utilizes SPASE metadata generation for RBSP data products. Autoplot, originally designed for ViRBO, allows users to create sensible visualizations from provided data URLs. This cross-platform tool supports multiple data sources and includes features such as one-click launch, bookmarks, and configuration files. By integrating feedback, ViRBO aims to continuously improve the software and develop views for RBSP data products, facilitating better data analysis.

E N D
ViRBO Overview • Virtual Radiation Belt Observatory • Facilitate Search, Access, and Visualization of Radiation Belt Data • Search – Develop SPASE Metadata associated with RB data. ViRBO will handle SPASE generation for RBSP data products. • Access – Collect code and tools for access; host meeting web pages • Visualization – Autoplot is our primary tool
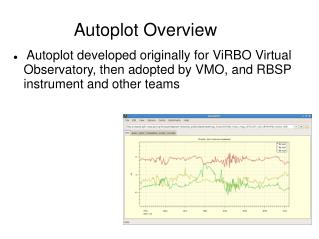
Autoplot Overview • Autoplot interface was a project originally developed for ViRBO. • Goal: Given a URL to a data file, make a sensible plot. A browser for data on the web. • Used existing libraries (“das2”) and tools and extended them for VxO use. • Continued support or code contributions from HPDE, ViRBO, VMO, RBSP-ECT, and the Radio and Plasma Wave Group at The University of Iowa.
Comparison • View many types of data from many data sources • Works on any operating system • Analysis possible (Python) • No license • One-click launch • Bookmarks • Configuration files
Three Access Points • Through CDAWeb interface – click Autoplot link after selecting data • Launch Autoplot - select CDAWeb bookmarks (will be a part of default install soon) • Using View links on ViRBO web page
3. Using View Links • We have extended Autoplot to allow “views” of data to be saved as a configuration (VAP=ViRBOAutoplot file). • We are in the process of creating view pages for data products. • View metadata will be searchable via ViRBO
ViRBO/RBSP interaction • We will develop views of RBSP data using Autoplot/CDAWeb interface. • We will develop basic views and request feedback. • We will continue to develop software that makes view development easier.