Download

1 / 42
420 likes | 554 Vues
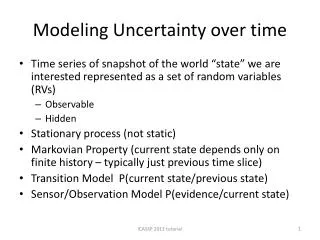
Modeling Utilities over Time. Vilija R. Joyce, MS January 11, 2012. Objectives. To describe how to analyze health-related quality of life (HRQoL) data with multiple observations over time. Outline. Introduction to types of longitudinal studies and models

E N D
Modeling Utilities over Time Vilija R. Joyce, MS January 11, 2012
Objectives • To describe how to analyze health-related quality of life (HRQoL) data with multiple observations over time
Outline • Introduction to types of longitudinal studies and models • Real-world example: Modeling the change in health-related quality of life (HRQoL) in patients with advanced HIV • OPTIMA • Exploratory analysis • Models
3 Important Features of Longitudinal Studies • Multiple waves of data • Sensible metric for time • Outcomes that change systematically over time • Precision of outcomes must be equatable over time • Outcomes must be equally valid over time • Preserve outcome precision over time
Repeated Measures Models • Applicable to studies where… • Subjects are experiencing the same condition • Assessments correspond to an event or intervention phase • Assessments are limited (< 4) with time conceptualized as a categorical variable
Repeated Measures Models (cont’d) Fairclough DL. Design and Analysis of Quality of Life Studies in Clinical Trials. 2nd ed. Boca Raton, FL: Chapman and Hall/CRC Press; 2010.
Repeated Measures Models – Drawbacks • Assessments may not take place when scheduled.
Repeated Measures Models – Drawbacks (cont’d) • Timing of observations for 1 site over 1 year in the OPTIMA trial
History of Growth Curve Models • 1980s = development of statistical models • Various names • Individual growth curve models • Random coefficient models • Hierarchical linear models • Multilevel models • Mixed models • Describe changes in height and weight as a function of age in children.
Why Not Use OLS? • Ordinary least squares (OLS) regression assumes that observations are independent • Biased standard errors • Growth curve models can handle correlated errors
Definition of a Growth Curve Model • Change over time in a phenomenon of interest (e.g. quality of life) at both the individual and aggregate levels. • 2 types of questions about change: Level 1: Within-person change (how individuals change over time) Time-varying predictors (e.g. days since randomization) Level 2: Between-person differences in change (how changes vary across individuals) Time-invariant predictors (e.g. randomization group)
Level 1 Submodel – Within-Person Yij = The outcome of interest (for subject i at time j ) π0i = Intercept, or subject i’s true value of QoL at baseline π1i = Slope, or subject i’s rate of change in true QoL εij = Residual or random measurement error
Level 2 Submodels – Between-Person Level 1 model Level 2 submodels ITVN = Intervention γ00 = Population intercept γ01 = Deviation from population intercept ζ0i = Residual γ10 = Population slope γ11 = Deviation from population slope ζ1i = Residual
Integrated Growth Curve Model Level 1 model Level 2 submodels Fixed Effects Random Effects
Advantages of Growth Curve Models • Advantages • Data modeled at the individual level • Flexible time variable • Easy handling of missing data • Easily incorporate data nesting/clustering
Outline • Introduction to types of longitudinal studies and models • Real-world example: Modeling the change in health-related quality of life (HRQoL) in patients with advanced HIV • OPTIMA • Exploratory analysis • Models
OPTIMA • Effective antiretroviral therapy (ART) improves survival in HIV-infected patients. • The optimal management strategy for advanced HIV patients infected with multi-drug resistant HIV is unclear. • CSP #512, Options in Management with Antiretrovirals • 2x2 open randomized study • 3 month therapy interruption vs. no interruption • Treatment intensification (5+ antiretroviral drugs) vs. standard treatment (4 or fewer drugs) • UK, Canada, and US • June 2001 - December 2007 • 368 patients randomized
Outcomes • Primary and secondary outcomes • Time to first AIDS-defining event or death • Time to first serious adverse event • No significant differences in outcomes among the management strategy groups
Outcomes (cont’d) • Other sociodemographic and clinical data (e.g. age, sex, serious adverse events) • Health-Related Quality of Life (HRQoL) • Baseline, 6, 12, 24, every 12 weeks thereafter • Health Utilities Index Mark 3 (HUI3) • EQ-5D • Visual analog scale • Medical Outcomes Study HIV Health Survey • Standard gamble (SG) (US patients only) • Time trade-off (TTO) (US patients only) • 5,141 HRQoL assessments over 6.25 years of follow-up (median 3.2 years)
HRQoL Outcome: Health Utilities Index Mark 3 (HUI3) • Preference/utility-based instrument • 17 questions, 8 attributes, each with 5–6 levels • 972,000 possible health states. • Weights are estimated with valuation data from a sample of adults in Hamilton, Ontario, Canada • Utilities range from -0.36 to 1
Research Questions • What is the longitudinal effect of treatment intensification on HRQoL in patients with advanced HIV? • What is the effect of ongoing serious adverse events (a time-dependent predictor) on HRQoL?
Outline • Introduction to types of longitudinal studies and models • Real-world example: Modeling the change in health-related quality of life (HRQoL) in patients with advanced HIV • OPTIMA • Exploratory analysis • Models
Missing Data • Why is missing data a problem? • Loss of statistical power • Bias of estimates • At baseline, 4% of HUI3 assessments in the OPTIMA trial were missing. • Plots to describe missingness • Average QoL scores by time of drop-out • Average QoL scores by time to death • Average QoL scores by % missing over time
Mean HUI3 by Visit Week, Patients Grouped by When They Were Lost to Follow-Up
Missing Data • Other patterns/mechanisms? • Do baseline characteristics predict drop-out? • Proportional hazards model (PROC PHREG) • Are “skippers” - patients with intermittent QOL assessments – different from those with few skipped assessments? • Regressions (PROC REG) • Are certain clinical events associated with “missing” QoL assessments? • Generalized linear mixed model (PROC GLIMMIX)
Missing Data • What next? • Serious adverse events predicted missing HRQoL data in the OPTIMA trial. • BUT, serious adverse events were distributed equally among the randomization groups. • Missing data left “as is”. • Other QoL studies, where missing data are not ignorable? • Consider imputation as part of your sensitivity analyses. • Fairclough 2010, Ch. 9, Multiple Imputation
Excerpt from person-period OPTIMA HRQoL dataset • Each subject has multiple records, one per assessment
Level 1: Within-Person Change over Time Level 1 model
Level 2: Differences in Change Across People Level 2 submodels
Outline • Introduction to types of longitudinal studies and models • Real-world example: Modeling the change in health-related quality of life (HRQoL) in patients with advanced HIV • OPTIMA • Exploratory analysis • Models
Research Questions • What is the longitudinal effect of treatment intensification on HRQoL in patients with advanced HIV? • What is the effect of ongoing serious adverse events (a time-dependent predictor) on HRQoL?
Model for longitudinal treatment effect • What is the longitudinal effect of treatment intensification on HRQoL in patients with advanced HIV? proc mixed data = qol; /*1. Evokes mixed procedure, identifies dataset, specifies */ /* default estimation method or restrict max likelihood*/ model hui3 = /*2. Dependent variable, QOL instrument HUI3*/ time_years /*3. Time in years*/ intensify /*4. Intensification group indicator*/ time_years*intensify /*5. Interaction term, time in years*intensification*/ / solution ddfm=kr; /*6. Significance tests for all fixed effects and Kenward-*/ /* Roger method of degrees of freedom*/ random int time_years / /*7. Specifies the intercept and time as random effects*/ subject=id /*8. Specifies observations as nested within ID*/ type=un; /*9. Specifies an unstructured variance/covariance matrix*/ /* for the random effects*/ run;
Results The Mixed Procedure Covariance Parameter Estimates CovParm Subject Estimate Error Value Pr Z UN(1,1) id 0.07349 0.006017 12.21 <.0001 /* Variance estimate for intercept*/ UN(2,1) id -0.00416 0.001222 -3.41 0.0007 /* Covariance estimate for intercept and slope*/ UN(2,2) id 0.002837 0.000427 6.64 <.0001 /* Variance estimate for slope*/ Residual 0.02942 0.000653 45.08 <.0001 /* Level 1 residual*/ Fit Statistics -2 Res Log Likelihood -1753.4 AIC (smaller is better) -1745.4 AICC (smaller is better) -1745.3 BIC (smaller is better) -1729.7
Results (cont’d) Solution for Fixed Effects Standard Effect Estimate Error DF t Value Pr > |t| Intercept 0.5967 0.02056 358 29.02 <.0001 /* γ00 */ time_years -0.01005 0.005510 191 -1.82 0.0696 /* γ10 */ intensify 0.03245 0.02970 359 1.09 0.2754 /* γ01 */ time_years*intensify -0.00348 0.007979 188 -0.44 0.6634 /* γ11 */ Conclusions: - no sustained differences in HUI3 HRQoL scores between the 2 groups and over time
Research Questions • What is the longitudinal effect of treatment intensification on HRQoL in patients with advanced HIV? • What is the effect of ongoing serious adverse events (a time-dependent predictor) on HRQoL?
Model for effect of ongoing serious adverse events (SAE) • What is the effect of ongoing serious adverse events on HRQoL? proc mixed data = qol; /*1. Evokes mixed procedure, identifies dataset, specifies */ /* default estimation method or restrict max likelihood*/ model hui3 = /*2. Dependent variable, QOL instrument HUI3*/ time_years /*3. Time in years*/ sae_ongoing /*4. Indicator ongoing serious adverse event (SAE)*/ time_years*sae_ongoing /*5. Interaction term, time in years*SAE*/ / solution ddfm=kr; /*6. Significance tests for all fixed effects and Kenward-*/ /* Roger method of degrees of freedom*/ random int time_years / /*7. Specifies the intercept and time as random effects*/ subject=id /*8. Specifies observations as nested within ID*/ type=un; /*9. Specifies an unstructured variance/covariance matrix*/ /* for the random effects*/ run;
Results Solution for Fixed Effects Standard Effect Estimate Error DF t Value Pr > |t| Intercept 0.6130 0.01483 363 41.32 <.0001 /* γ00 */ time_years -0.00922 0.003879 192 -2.38 0.0185 /* γ10 */ sae_ongoing -0.03967 0.02604 4575 -1.52 0.1278 /* γ20 */ time_year*sae_ongoin -0.03445 0.01116 4429 -3.09 0.0020 /* γ30 */ • Conclusions: • - Effect of ongoing SAE status varies over time • Rate of change in HUI3 scores over time differs by ongoing SAE status • -.009/year (no ongoing SAEs) • vs. • -.04/year (ongoing SAEs; -0.00922+ -0.03445)
A few final notes • Centering • Simplifies interpretation • 2x2 trial? • Treatment A, Treatment B, Both • 0.5 = patient randomized to the group • -0.5 = patient not randomized to the group • Ex. Randomized to both? A=.5; B=.5; AB=.25
A few final notes (cont’d) • Model fit • Deviance statistic (-2 Res Log Likelihood) • Models must be estimated using identical data • Models must be nested within one another • Akaike Information Criteria (AIC)/Bayesian Information Criteria (BIC) • Models must be fit to the identical set of data; not-nested OK • Smaller information criterion is better • Raftery (1995) on BIC • 0-2 “weak” • 2-6 “positive” • 6-10 “strong” • >10 “very strong”
Summary • Introduction to growth curve modeling. • Application of growth curve modeling to longitudinal quality of life data from OPTIMA. • Growth curve modeling is powerful and flexible!
Suggested References • Fairclough DL. Design and Analysis of Quality of Life Studies in Clinical Trials. 2nd ed. Boca Raton, FL: Chapman and Hall/CRC Press; 2010. • Singer JD, Willett JB. Applied Longitudinal Analysis. Modeling Change and Event Occurrence. 1st ed. New York, NY: Oxford University Press; 2003. • http://www.ats.ucla.edu/stat/examples/alda/ • UCLA Academic Technology Service Statistical Computing • http://www.ats.ucla.edu/stat/
Questions? • Next presentation – February 1, 2012 • Budget Impact Analysis (Patsi Sinnott, P.T., Ph.D., M.P.H.) • Register: http://www.hsrd.research.va.gov/cyberseminars/catalog-upcoming.cfm?SeriesSort=HCEA Vilija R. Joyce, MS Health Economics Resource Center (HERC) VA Palo Alto Healthcare System 795 Willow Road (152) Menlo Park, CA USA (650) 493-5000 ext. 2-23852 vilija.joyce@va.gov