Download
1 / 40
400 likes | 628 Vues
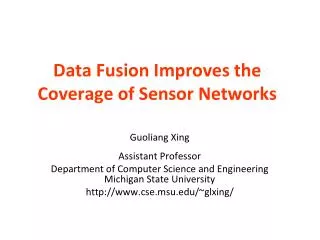
Data Fusion Improves the Coverage of Sensor Networks. Guoliang Xing Assistant Professor Department of Computer Science and Engineering Michigan State University http://www.cse.msu.edu/~glxing/. Outline. Background Problem definition Coverage of large-scale sensor networks

E N D
Data Fusion Improves the Coverage of Sensor Networks Guoliang Xing Assistant Professor Department of Computer Science and EngineeringMichigan State University http://www.cse.msu.edu/~glxing/
Outline • Background • Problem definition • Coverage of large-scale sensor networks • Scaling laws of coverage • Other projects • Model-driven concurrent medium access control • Integrated coverage and connectivity configuration 2
Mission-critical Sensing Applications • Large-scale network deployments • OSU ExScal project: 1450 nodes deployed in a 1260X288 m2 region • Resource-constrained sensor nodes • Limited sensing performance • Stringent performance requirements • High sensing probability, e.g., 90%, low false alarm rate, e.g., 5%, bounded delay, e.g., 20s 3
Sensing Coverage • Fundamental requirement of critical apps • How well is a region monitored by sensors? • Coverage of static targets • How likely is a target detected? 4
Network Density for Achieving Coverage • How many sensors are needed to achieve full or instant coverage of a geographic region? • Any static target can be detected at a high prob. • Significance of reducing network density • Reduce deployment cost • Prolong lifetime by putting redundant sensors to sleep 5
State of the Art • K-coverage • Any physical point in a large region must be detected by at least K sensors • Coverage of mobile targets • Any target must be detected within certain delay • Barrier coverage • All crossing paths through a belt region must be k-covered • Most previous results are based on simplistic models • All 5 papers on the coverage problem published at MobiCom since 2004 assumed the disc model 6
Single-Coverage under Disc Model • Deterministic deployment • Optimal pattern is hexagon • Random deployment • Sensors deployed by a Poisson point process of density ρ • The coverage (fraction of points covered by at least one sensor): [Liu 2004] 7 deterministic deployment random deployment
Sensing Model • The (in)famous disc model • Sensor can detect any target within range r • Real-world sensor detection • There is no cookie-cutter “sensing range”! r Acoustic Vehicle Tracking Data in DARPA SensIT Experiments [Duarte 04]
Contributions • Introduce probabilistic and collaborative sensing models in the analysis of coverage • Data fusion: sensors combine data for better inferences • Derive scaling laws of network density vs. coverage • Coverage of both static and moving targets • Compare the performance of disc and fusion models • Data fusion can significantly improve coverage!
Outline • Background • Problem definition • Coverage of large-scale sensor networks • Scaling laws of coverage • Other projects • Model-driven concurrent medium access control • Integrated coverage and connectivity configuration • Personal perspectives on research 10
Sensor Measurement Model • Sensor reading yi = si + ni • Decayed target energy si = S · w(xi) • Noise energy follows normal distribution ni ~ N(μ,σ2) , 2≤ k ≤5 Acoustic Vehicle Tracking Data in DARPA SensIT Experiments [Duarte 04]
Single-sensor Detection Model • Sensor reading yi • H0 – target is absent • H1 – target is present noise energy distribution sensor reading distribution false alarm rate: probability detection probability: energy t Q(·) – complementary CDF of the std normal distribution false alarm rate detection threshold detection probability 12
Data Fusion Model • Sensors within distance R from target fuse their readings • R is the fusion range • The sum of readings is compared again a threshold η • False alarm rate PF = 1-χn(n· η) • Detection probability PD = 1 –χn(n·η - Σw(xi)) R χn– CDF of Chi-square distribution w(xi) – Energy reading of sensor xi from target 13
Outline • Background • Problem definition • Coverage of large-scale sensor networks • Scaling laws of coverage • Coverage of static targets • Other projects • Model-driven concurrent medium access control • Integrated coverage and connectivity configuration • Personal perspectives on research 14
(α,β)-coverage • A physical point p is (α,β)-covered if • The system false alarm rate PF ≤ α • For target at p, the detection prob. PD ≥ β • (α,β)-coverage is the fraction of points in a region that is (α,β)-covered • Full (0.01, 0.95)-coverage: system false alarm rate is no greater than 1%, and the prob. of detecting any target in the region is no lower than 95% 15
Extending the Disc Model • Classical disc model is deterministic • Extends disc model to stochastic detection • Choose sensing range r such that if any point is covered by at least one sensor, the region is (α,β)-covered • Previous results based on disc model can be extended to (α,β)-coverage δ-- signal to noise ratio S/σ 16
Disc and Fusion Coverage • Coverage under the disc model • Sensors independently detect targets within sensing range r • Coverage under the fusion model • Sensors collaborate to detect targets within fusion rangeR 17
(α,β)-coverage under Fusion Model • The (α,β)-coverage of a random network is given by F(p) – set of sensors within fusion range of point p N(p)– # of sensors in F(P) optimal fusion range 18
Network Density for Full Coverage • ρf and ρd are densities of random networks under fusion and disc models • Sensing range is a constant • Opt fusion range grows with network density ρf <ρdwhen high coverage is required 19
Network Density w Opt Fusion Range • When fusion range is optimized with respect to network density • When k=2 (acoustic signals) • Data fusion significantly reduces network density , 2≤ k ≤5
Network Density vs. SNR • For any fixed fusion range • The advantage of fusion decreases with SNR 21
Trace-driven Simulations • Data traces collected from 75 acoustic nodes in vehicle detection experiments from DARPA SensIT project • α=0.5, β=0.95, deployment region: 1000m x 1000m
Simulation on Synthetic Data • k=2, target position is localized as the geometric center of fusing nodes 23
Conclusions • Bridge the gap between data fusion theories and performance analysis of sensor networks • Derive scaling laws of coverage vs. network density • Data fusion can significantly improve coverage! • Help to understand the limitation of current analytical results based on ideal sensing models • Provide guidelines for the design of data fusion algorithms for large-scale sensor networks 24
Outline • Background • Problem definition • Coverage of large-scale sensor networks • Scaling laws of coverage • Coverage of static targets • Other projects • Model-driven concurrent medium access control • Integrated coverage and connectivity configuration • Personal perspectives on research 25
Improve Throughput by Concurrency • Enable concurrency by controlling senders' power s1 s2 r1 r2 +
Received Signal Strength • 18 Tmotes with Chipcon 2420 radio • Near-linear RSSdBm vs. transmission power level • Non-linear RSSdBm vs. log(dist), different from the classical model! Received Signal Strength (dBm) Received Signal Strength (dBm) Transmission Power Level Transmission Power Level 27
Packet Reception Ratio vs. SINR • Classical model doesn't capture the gray region 0~3 dB is "gray region" Packet Reception Ratio (%) parking lot, no interferer office, no interferer office, 1 interferer 28
C-MAC Components Power Control Model Currency Check Concurrent Transmission Engine Handshaking Online Model Estimation Interference Model Throughput Prediction Throughput Prediction • Implemented in TinyOS 1.x, evaluated on a 18-mote test-bed • Performance gain over TinyOS default MAC is >2X Presented at IEEE Infocom 2009 29
Performance Evaluation • Implemented in TinyOS 1.x • 16 Tmotes deployed in a 25x24 ft office • 8 senders and 8 receivers
Experimental Results Improve throughput linearly w num of senders system throughput (Kbps) system throughput (Kbps) Number of Senders Time (second)
Deterministic Coverage + Connectivity • Select a set of nodes to achieve • K-coverage: every point is monitored by at least K sensors • N-connectivity: network is still connected if N-1 nodes fail Active nodes Sensing range Sleeping node Communicating nodes A network with 1-coverage and 1-connectivity 32
Connectivity vs. Coverage: Analytical Results • Network connectivity does not guarantee coverage • Connectivity only concerns with node locations • Coverage concerns with all locations in a region • If Rc/Rs 2 • K-coverage K-connectivity • Implication: given requirements of K-coverage and N-connectivity, only needs to satisfy max(K, N)-coverage • Solution: Coverage Configuration Protocol (CCP) • If Rc/Rs< 2 • CCP + connectivity mountainous protocols ACM Conference on Embedded Networked Sensor Systems (SenSys), 2003 ACM Transactions on Sensor Networks, Vol. 1 (1), 2005 (~600 citations on Google Scholar) 33
Research Summary • Data fusion in sensor networks • Coverage [MobiCom 09]; deployment[RTSS 08]; mobility [ICDCS 08] • MAC protocol design and architecture • C-MAC: concurrent model-driven MAC [Infocom08] • UPMA: unified power management architecture [IPSN 07] • Sensornet/real-time middleware • MobiQuery: spatiotemporal query service for mobile users [ICDCS 05, IPSN 05] • nORB: light-weight real-time middleware for networked embedded systems [RTAS 04] • Controlled mobility • Mobility-assisted spatiotemporal detection [ICDCS 08,IWQoS 08] • Rendezvous-based data transport [MobiHoc 08, RTSS 07] • Power management • Minimum power configuration [MSWiM 07, MobiHoc 05, TOSN 3(2)] • Integrated coverage and connectivity configuration [TOSN 1(1), SenSys 03] • Impact of sensing coverage on geographic routing [TPDS 17(4), MobiHoc 04] • Real-time power-aware routing in sensor networks [IWQoS 06] • Data fusion for target detection [IPSN 04]
Acknowledgement • Students • Rui Tan, Mo Sha • Collaborators • Benyuan Liu, Jianping Wang…..
Michigan State University • First land-grant institution • Founded in 1855, prototype for 69 land-grant institutions established under the Morrill Act of 1862 • One of America's Public Ivy universities • Big ten conferences • University of Illinois, Indiana University, University of Iowa, University of Michigan, University of Minnesota, Northwestern University, Ohio State University, Pennsylvania State University,Purdue University, University of Wisconsin • Single largest campus, 8th largest university in the US with 46,648 students and 2,954 faculty members • Rankings of 2008 • 80th worldwide, Shanghai Jiao Tong University’s Institute of Higher Education • 71th in US, U.S. News & World Report
Computer Science & Engineering @MSU • People • 27 tenure-stream faculty • Each year awards approximately 100 BS, 40 MS, and 10 PhD degrees in Computer Science • Research • 9 research laboratories, with annual research expenditures exceeding $3.5 million • Rankings • 15th graduate program in US, a recent article of Comm. of ACM • Top 100, Shanghai Jiao Tong University’s Institute of Higher Education
My Group • Research • Sensor networks • Data fusion, power management, voice streaming, controlled mobility • Low-power wireless networks • MAC, Interference management • Cyber-physical systems • Students • Supervise 6 PhDs (CityU and MSU), 2 MS • Co-supervise 4 PhDs (CAS, CWM, UTK, MSU)
Ranking of Journals* • Tier 1 • IEEE/ACM Trans. on Networking (TON) • Tier 1.5 • ACM Trans. on Sensor Networks (TOSN) • IEEE Trans. on Mobile Computing (TMC) • IEEE Trans. on Computers (TC) • IEEE Trans. on Parallel and Distributed Systems (TPDS) *The ranking is only applicable to Sensor Network research
Ranking of Conferences* • Tier 0: SIGCOMM, MobiCom (~10%)[1] • Tier 1: MobiHoc (10~15%)[3], SenSys[1], MobiSys (15~18%), • Tier 1.5: Infocom[1], ICDCS (~18%) [3], RTSS[4] (20~25%), ICNP, PerCom (10-15%) • Tier 2:IPSN[3], IWQoS, [1] MSWiM (20~25%) [1], MASS[2], DCOSS (~25%) • Tier 4: Globecom, WCNC, ICC…..(>30%) *Partially borrowed from Prof. Dong Xuan’s talk *The ranking is only applicable to Sensor Network research, and may significantly change for other fields