Download
1 / 45
450 likes | 617 Vues
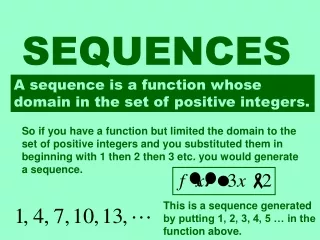
Sequences are related. Darwin: all organisms are related through descent with modification Related molecules have similar functions in different organisms. Phylogenetic tree based on ribosomal RNA: three domains of life. Sequences are related, II.

E N D
Sequences are related • Darwin: all organisms are related through descent with modification • Related molecules have similar functions in different organisms Phylogenetic tree based on ribosomal RNA: three domains of life
Sequences are related, II Phylogenetic tree of globin-type proteins found in humans
Why compare sequences? • Determination of evolutionary relationships • Prediction of protein function and structure (database searches). Protein 1: binds oxygen Sequence similarity Protein 2: binds oxygen ?
Dotplots: visual sequence comparison • Place two sequences along axes of plot • Place dot at grid points where two sequences have identical residues • Diagonals correspond to conserved regions
Pairwise alignments 43.2% identity; Global alignment score: 374 10 20 30 40 50 alpha V-LSPADKTNVKAAWGKVGAHAGEYGAEALERMFLSFPTTKTYFPHF-DLS-----HGSA : :.: .:. : : :::: .. : :.::: :... .: :. .: : ::: :. beta VHLTPEEKSAVTALWGKV--NVDEVGGEALGRLLVVYPWTQRFFESFGDLSTPDAVMGNP 10 20 30 40 50 60 70 80 90 100 110 alpha QVKGHGKKVADALTNAVAHVDDMPNALSALSDLHAHKLRVDPVNFKLLSHCLLVTLAAHL .::.::::: :.....::.:.. .....::.:: ::.::: ::.::.. :. .:: :. beta KVKAHGKKVLGAFSDGLAHLDNLKGTFATLSELHCDKLHVDPENFRLLGNVLVCVLAHHF 60 70 80 90 100 110 120 130 140 alpha PAEFTPAVHASLDKFLASVSTVLTSKYR :::: :.:. .: .:.:...:. ::. beta GKEFTPPVQAAYQKVVAGVANALAHKYH 120 130 140
Pairwise alignment 100.000% identity in 3 aa overlap SPA ::: SPA Percent identity is not a good measure of alignment quality
Pairwise alignments: alignment score 43.2% identity; Global alignment score: 374 10 20 30 40 50 alpha V-LSPADKTNVKAAWGKVGAHAGEYGAEALERMFLSFPTTKTYFPHF-DLS-----HGSA : :.: .:. : : :::: .. : :.::: :... .: :. .: : ::: :. beta VHLTPEEKSAVTALWGKV--NVDEVGGEALGRLLVVYPWTQRFFESFGDLSTPDAVMGNP 10 20 30 40 50 60 70 80 90 100 110 alpha QVKGHGKKVADALTNAVAHVDDMPNALSALSDLHAHKLRVDPVNFKLLSHCLLVTLAAHL .::.::::: :.....::.:.. .....::.:: ::.::: ::.::.. :. .:: :. beta KVKAHGKKVLGAFSDGLAHLDNLKGTFATLSELHCDKLHVDPENFRLLGNVLVCVLAHHF 60 70 80 90 100 110 120 130 140 alpha PAEFTPAVHASLDKFLASVSTVLTSKYR :::: :.:. .: .:.:...:. ::. beta GKEFTPPVQAAYQKVVAGVANALAHKYH 120 130 140
Alignment scores: substitution matrices A C G T A5-4 -4 -4 C -45-4 -4 G -4 -45-4 T -4 -4 -45 A C G G C A : : : : A G G G T A 5-4+5+5-4+5 = 12 Standard DNA identity matrix Scoring example
Pairwise alignments: insertions/deletions 43.2% identity; Global alignment score: 374 10 20 30 40 50 alpha V-LSPADKTNVKAAWGKVGAHAGEYGAEALERMFLSFPTTKTYFPHF-DLS-----HGSA : :.: .:. : : :::: .. : :.::: :... .: :. .: : ::: :. beta VHLTPEEKSAVTALWGKV--NVDEVGGEALGRLLVVYPWTQRFFESFGDLSTPDAVMGNP 10 20 30 40 50 60 70 80 90 100 110 alpha QVKGHGKKVADALTNAVAHVDDMPNALSALSDLHAHKLRVDPVNFKLLSHCLLVTLAAHL .::.::::: :.....::.:.. .....::.:: ::.::: ::.::.. :. .:: :. beta KVKAHGKKVLGAFSDGLAHLDNLKGTFATLSELHCDKLHVDPENFRLLGNVLVCVLAHHF 60 70 80 90 100 110 120 130 140 alpha PAEFTPAVHASLDKFLASVSTVLTSKYR :::: :.:. .: .:.:...:. ::. beta GKEFTPPVQAAYQKVVAGVANALAHKYH 120 130 140
Alignment scores: insertions/deletions C A T A G G G T A T T G C A T A - - - - A T T G -10 + 3 x (-0.1)=-10.3 Affine gap penalties: Multiple insertions/deletions may be one evolutionary event => Separate penalties for gap opening and gap elongation
Pairwise alignments: conservative substitutions 43.2% identity; Global alignment score: 374 10 20 30 40 50 alpha V-LSPADKTNVKAAWGKVGAHAGEYGAEALERMFLSFPTTKTYFPHF-DLS-----HGSA : :.: .:. : : :::: .. : :.::: :... .: :. .: : ::: :. beta VHLTPEEKSAVTALWGKV--NVDEVGGEALGRLLVVYPWTQRFFESFGDLSTPDAVMGNP 10 20 30 40 50 60 70 80 90 100 110 alpha QVKGHGKKVADALTNAVAHVDDMPNALSALSDLHAHKLRVDPVNFKLLSHCLLVTLAAHL .::.::::: :.....::.:.. .....::.:: ::.::: ::.::.. :. .:: :. beta KVKAHGKKVLGAFSDGLAHLDNLKGTFATLSELHCDKLHVDPENFRLLGNVLVCVLAHHF 60 70 80 90 100 110 120 130 140 alpha PAEFTPAVHASLDKFLASVSTVLTSKYR :::: :.:. .: .:.:...:. ::. beta GKEFTPPVQAAYQKVVAGVANALAHKYH 120 130 140
Amino acid properties Aspartic acid (D) and Glutamic acid (E) have similar properties Serine (S) and Threonine (T) have similar physicochemical properties => Substitution of S/T or E/D should result in scores that are only moderately lower than identities
A C transition G T transversion Substitution scores: similar residues score higher Different transition and transversion costs: A C G T A 5-4-1-4 C -45-4-1 G -1-45-4 T -4-1-45 A C G G C A : : : : A G G G T A 5-4+5+5-1+5 = 15
Protein substitution matrices • BLOSUM50 matrix: • Positive scores on diagonal (identities) • Similar residues get higher scores • Dissimilar residues get smaller (negative) scores A 5 R -2 7 N -1 -1 7 D -2 -2 2 8 C -1 -4 -2 -4 13 Q -1 1 0 0 -3 7 E -1 0 0 2 -3 2 6 G 0 -3 0 -1 -3 -2 -3 8 H -2 0 1 -1 -3 1 0 -2 10 I -1 -4 -3 -4 -2 -3 -4 -4 -4 5 L -2 -3 -4 -4 -2 -2 -3 -4 -3 2 5 K -1 3 0 -1 -3 2 1 -2 0 -3 -3 6 M -1 -2 -2 -4 -2 0 -2 -3 -1 2 3 -2 7 F -3 -3 -4 -5 -2 -4 -3 -4 -1 0 1 -4 0 8 P -1 -3 -2 -1 -4 -1 -1 -2 -2 -3 -4 -1 -3 -4 10 S 1 -1 1 0 -1 0 -1 0 -1 -3 -3 0 -2 -3 -1 5 T 0 -1 0 -1 -1 -1 -1 -2 -2 -1 -1 -1 -1 -2 -1 25 W -3 -3 -4 -5 -5 -1 -3 -3 -3 -3 -2 -3 -1 1 -4 -4 -3 15 Y -2 -1 -2 -3 -3 -1 -2 -3 2 -1 -1 -2 0 4 -3 -2 -2 2 8 V 0 -3 -3 -4 -1 -3 -3 -4 -4 4 1 -3 1 -1 -3 -2 0 -3 -1 5 A R N D C Q E G H I L K M F P S T W Y V
Estimation of the BLOSUM 50 matrix • For each alignment in the BLOCKS database the sequences are grouped into clusters with at least 50% identical residues (for BLOSUM 50) • All pairs of sequences are compared, and the observed pair frequencies are noted (e.g., A is paired with A in 40% of all cases, A with C in 1.2%, etc.) • Expected pair frequencies are computed from single amino acid frequencies. • For each amino acid pair the substitution scores are essentially computed as: ID FIBRONECTIN_2; BLOCK COG9_CANFA GNSAGEPCVFPFIFLGKQYSTCTREGRGDGHLWCATT COG9_RABIT GNADGAPCHFPFTFEGRSYTACTTDGRSDGMAWCSTT FA12_HUMAN LTVTGEPCHFPFQYHRQLYHKCTHKGRPGPQPWCATT HGFA_HUMAN LTEDGRPCRFPFRYGGRMLHACTSEGSAHRKWCATTH MANR_HUMAN GNANGATCAFPFKFENKWYADCTSAGRSDGWLWCGTT MPRI_MOUSE ETDDGEPCVFPFIYKGKSYDECVLEGRAKLWCSKTAN PB1_PIG AITSDDKCVFPFIYKGNLYFDCTLHDSTYYWCSVTTY SFP1_BOVIN ELPEDEECVFPFVYRNRKHFDCTVHGSLFPWCSLDAD SFP3_BOVIN AETKDNKCVFPFIYGNKKYFDCTLHGSLFLWCSLDAD SFP4_BOVIN AVFEGPACAFPFTYKGKKYYMCTRKNSVLLWCSLDTE SP1_HORSE AATDYAKCAFPFVYRGQTYDRCTTDGSLFRISWCSVT COG2_CHICK GNSEGAPCVFPFIFLGNKYDSCTSAGRNDGKLWCAST COG2_HUMAN GNSEGAPCVFPFTFLGNKYESCTSAGRSDGKMWCATT COG2_MOUSE GNSEGAPCVFPFTFLGNKYESCTSAGRNDGKVWCATT COG2_RABIT GNSEGAPCVFPFTFLGNKYESCTSAGRSDGKMWCATS COG2_RAT GNSEGAPCVFPFTFLGNKYESCTSAGRNDGKVWCATT COG9_BOVIN GNADGKPCVFPFTFQGRTYSACTSDGRSDGYRWCATT COG9_HUMAN GNADGKPCQFPFIFQGQSYSACTTDGRSDGYRWCATT COG9_MOUSE GNGEGKPCVFPFIFEGRSYSACTTKGRSDGYRWCATT COG9_RAT GNGDGKPCVFPFIFEGHSYSACTTKGRSDGYRWCATT FINC_BOVIN GNSNGALCHFPFLYNNHNYTDCTSEGRRDNMKWCGTT FINC_HUMAN GNSNGALCHFPFLYNNHNYTDCTSEGRRDNMKWCGTT FINC_RAT GNSNGALCHFPFLYSNRNYSDCTSEGRRDNMKWCGTT MPRI_BOVIN ETEDGEPCVFPFVFNGKSYEECVVESRARLWCATTAN MPRI_HUMAN ETDDGVPCVFPFIFNGKSYEECIIESRAKLWCSTTAD PA2R_BOVIN GNAHGTPCMFPFQYNQQWHHECTREGREDNLLWCATT PA2R_RABIT GNAHGTPCMFPFQYNHQWHHECTREGRQDDSLWCATT Pair-freq(obs) Pair-freq(expected) log
Protein substitution matrices • PAM series • Estimated from reconstructed phylogenetic trees of closely related sequences which tends to favor single base substitutions • Matrices for longer evolutionary distances are calculated by extrapolation • BLOSUM series • Estimated from ungapped core alignments of protein families (the BLOCKS database) • Extrapolation is not used – matrices for large evolutionary distances are calculated directly from the alignments
Substitution matrices and evolutionary distance • Substitution matrices come as series of matrices calculated for different evolutionary distances • ”Hard” matrices are designed for short distances • Hard matrices a designated by low numbers in the PAM series (20) and high numbers in the BLOSUM series (80) • Hard matrices correspond to short, highly conserved regions • ”Soft” matrices are designed for longer distances • Soft matrices have high PAM values (250) and low BLOSUM values (45) • Soft matrices correspond to longer, less well conserved regions
Pairwise alignment Optimal alignment: alignment having the highest possible score given a substitution matrix and a set of gap penalties
Pairwise alignment: the problem The number of possible pairwise alignments increases explosively with the length of the sequences: Two protein sequences of length 100 amino acids can be aligned in approximately 1060 different ways Time needed to test all possibilities is same order of magnitude as the entire lifetime of the universe.
Pairwise alignment: the solution ”Dynamic programming” (the Smith-Waterman algorithm)
Alignment depicted as path in matrix T C G C A T C C A TCGCA TC-CA T C G C A T C C A TCGCA T-CCA
Alignment depicted as path in matrix T C G C A T C C A Meaning of point in matrix: all residues up to this point have been aligned (but there are many different possible paths). x Position labeled “x”: TC aligned withTC --TC-TCTC TC--T-CTC
Dynamic programming: computation of scores T C G C A T C C A Any given point in matrix can only be reached from three possible positions (you cannot “align backwards”). => Best scoring alignment ending in any given point in the matrix can be found by choosing the highest scoring of the three possibilities. x Fill in scores one row at a time, starting in upper left corner of matrix, ending in lower right corner. Each new score is found by choosing the maximum of three possibilities. For each square in matrix: keep track of where best score came from. score(x,y-1) - gap-penalty score(x-1,y-1) + substitution-score(x,y) score(x-1,y) - gap-penalty score(x,y) = max
Dynamic programming: example A C G T A1-1 -1 -1 C -11-1 -1 G -1 -11-1 T -1 -1 -11 Gaps: -2
Dynamic programming: example T C G C A : : : : T C - C A 1+1-2+1+1 = 2
Global versus local alignments Global alignment: align full length of both sequences. Local alignment: find best partial alignment of two sequences Global alignment Seq 1 Local alignment Seq 2
Local alignment overview • The recursive formula is changed by adding a fourth possibility: zero. This means local alignment scores are never negative. • Trace-back is started at the highest value rather than in lower right corner • Trace-back is stopped as soon as a zero is encountered score(x,y-1) - gap-penalty score(x-1,y-1) + substitution-score(x,y) score(x-1,y) - gap-penalty 0 score(x,y) = max
Alignments: things to keep in mind “Optimal alignment” means “having the highest possible score, given substitution matrix and set of gap penalties”. This is NOT necessarily the biologically most meaningful alignment. Specifically, the underlying assumptions are often wrong: substitutions are not equally frequent at all positions, affine gap penalties do not model insertion/deletion well, etc. Pairwise alignment programs always produce an alignment - even when it does not make sense to align sequences.
Database searching Using pairwise alignments to search databases for similar sequences
Database searching Most common use of pairwise sequence alignments is to search databases for related sequences. For instance: find probable function of newly isolated protein by identifying similar proteins with known function. Most often, local alignments are used for database searching: you are interested in finding out if ANY domain in your protein looks like something that is known. Often, full Smith-Waterman is too time-consuming for searching large databases, so heuristic methods are used (fasta, BLAST).
Database searching: heuristic search algorithms FASTA (Pearson 1995) Uses heuristics to avoid calculating the full dynamic programming matrix Speed up searches by an order of magnitude compared to full Smith-Waterman The statistical side of FASTA is still stronger than BLAST BLAST (Altschul 1990, 1997) Uses rapid word lookup methods to completely skip most of the database entries Extremely fast One order of magnitude faster than FASTA Two orders of magnitude faster than Smith-Waterman Almost as sensitive as FASTA
BLAST flavors BLASTN Nucleotide query sequence Nucleotide database BLASTP Protein query sequence Protein database BLASTX Nucleotide query sequence Protein database Compares all six reading frames with the database TBLASTN Protein query sequence Nucleotide database ”On the fly” six frame translation of database TBLASTX Nucleotide query sequence Nucleotide database Compares all reading frames of query with all reading frames of the database
Searching on the web: BLAST at NCBI Very fast computer dedicated to running BLAST searches Many databases that are always up to date Nice simple web interface But you still need knowledge about BLAST to use it properly
Significance testing: a gentle reminder All tests of statistical significance involve a comparison between: (1) an observed value (2) the value that one would expect to find, on average, if only random variability was operating in the situation. P-value: probability of obtaining observed value by chance H0: coin is fair (50% heads) H1: coin is unfair (>50% heads) Test: 100 coin tosses, 59 heads P(x>=59 heads) = 4.46% Significantly different from random expectation (at the 5% level)
Alignment scores follow extreme value distributions Alignment of unrelated/random sequences result in scores following an extreme value distribution P(Sx) = 1-exp(-Kmne-x) m, n: sequence lengths. K, l: free parameters. This can be shown analytically for ungapped alignments and has been found empirically to also hold for gapped alignments under commonly used conditions.
Database searching: significance of hits Alignment algorithms will always produce alignments, regardless of whether it is meaningful or not => important to have way of selecting significant alignments from large set of database hits. Solution: fit distribution of scores from database search to extreme value distribution; determine p-value of hit from this fitted distribution. Example: scores fitted to extreme value distribution. 99.9% of this distribution is located below score=112 => hit with score = 112 has a p-value of 0.1%
Database searching: Expectancy (E) values In addition to p-values, database hits can be evaluated using expectancy values (E-values): The E value is the number of hits, having score S or greater, that would be expected for random reasons in a search over the entire database
Database searching: Expectancy (E) values E-values and p-values are related via the size of the database: E(score >= S) = database-size x P(score >= S) E.g., if a database contains 10.000 protein sequences, then a p-value of 0.1% corresponds to an E-value of: E = 10.000 x 0.1% = 10 E-values are a good measure of significance since they take the database size into account (typically you will want E-values well below 1).
Database searching: E-values in BLAST BLAST uses precomputed extreme value distributions to calculate E-values from alignment scores For this reason BLAST only allows certain combinations of substitution matrices and gap penalties This also means that the fit is based on a different data set than the one you are working on A word of caution: BLAST tends to overestimate the significance of its matches E-values from BLAST are fine for identifying sure hits One should be careful using BLAST’s E-values to judge if a marginal hit can be trusted (e.g., you may want to use E-values of 10-4 to 10-5).