Download
1 / 11
110 likes | 280 Vues
Science Measurements. Physical Science ( Notes in yellow ). Accuracy Vs. Precision. In science accuracy and precision are important to get the correct data. When you are accurate , all of your data is very close in numbers to each other (i.e.: 4.5, 4.6, 4.3)

E N D
Science Measurements Physical Science (Notes in yellow)
Accuracy Vs. Precision In science accuracy and precision are important to get the correct data. • When you are accurate, all of your data is very close in numbers to each other (i.e.: 4.5, 4.6, 4.3) • When you are precise, all of your data matches each other (i.e., 4.5, 4.5, 4.5)
Estimation When you estimate, you look at the place value to the right of the place value you are estimating to. If that number is 5 or above, then you will raise the place value by 1 number: Examples: tenths: 6.43 = 6.4 but 6.45 = 6.5 hundredths: 329.152 = 329.15 but 329.158 = 329.16 Whole numbers: 987.3= 987 but 169.82 = 170
Organizing Data • Mean, median and mode: When you analyze a set of data • Mean = average (add up numbers and divide by the amount of numbers you added) • 5 + 5+5 = 15 15 / 3 = 5 (mean) • median = the number that represents the “middle” of the data. YOU HAVE TO PUT THEM IN ORDER FROM SMALLEST TO LAST: • 6.2, 7.5, 4.3 put in order: 4.3 6.2 7.5 (median is 6.2) • mode = when you have a number that appears the most often • 23.7, 14.9, 23.7, 66.1 mode = 23.7 • range = subtract the smallest number from the largest: 66.1 – 14.9= 51.6
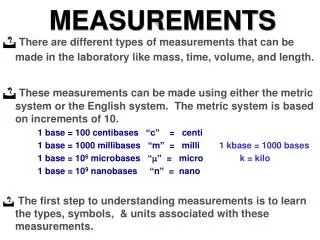
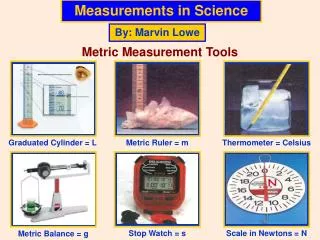
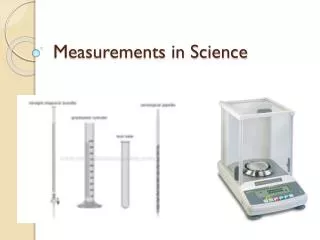
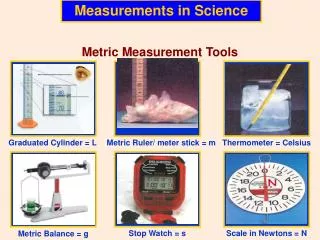
SI Units (Metric System) • The International System of Measurement (SI) • The metric system (SI) – used so scientists everywhere can communicate with each other. • Major units: • Length = meter mass = kilogram volume = liters (liquids) orcentimeters (if solid) • Temperature: In SI, Celsius is normally used instead of Fahrenheit. In science, Kelvin is often used for extreme temperatures. • Absolute zero: −273.15 oC or 0 K (no heat at all) Kelvin does not use a degree mark.
Mass vs Weight • Mass is the amount of material that makes up an object. (tent vs house) • Weight is completely dependent upon gravity. Since gravity varies in different places, then weight can change, but mass does not!
Common Formulas • Volume is how much space an object takes up (think box or bottle). • Reminders • Area = Length x width (l x w) = 2 sides square (cm2) • Volume = length x width x height (l x w x h) = 3 sidescubed (cm3) If measuring a liquid, then use liters (no exponent!) • Examples: 45 ml or 45 cm3 or 45 cc
Density • Density – This is a physical property - “thickness” of matter. It is the amount of mass per unit of volume. Formula: mass divided by volume = m/v • Example: an object that has a mass of 28g and a volume of 728 g 28g 7 ml = 4 g/ ml OR 7 cm3 = 4 cm3 • Question: Does a larger object always have greater density? Which has a greater density, a baseball or a beach ball? • WHEN YOU HAVE GREATER MASS COMPARED TO A SMALLER VOLUME, THE HIGHER THE DENSITY. • Rate is a ratio between 2 different types of measurement. For example: density is a ratio between mass and volume.
Graphs III. Graphs Used to visually see a change or comparison in data Line graph – shows a change over time
Bar Graphs Bar graph – shows a comparison between 2 or more objects or event
Circle Graphs Circle graph – uses a circle to show a breakdown to show percentages (out of 100%). Colors and patterns are often used to show the differences.