Neutrino Flux Analysis with Near Detector at EOROnu Meeting
220 likes | 340 Vues
Explore the Near Detector's ability to measure neutrino flux using quasi-elastic scattering off electrons. Detailed process simulations, detector design considerations, and data analysis techniques are discussed at the EOROnu Annual Meeting.

Neutrino Flux Analysis with Near Detector at EOROnu Meeting
E N D
Presentation Transcript
Near detector flux analysis Rosen Matev Roumen Tsenov (presenter) Yordan Karadzhov . St. Kliment Ohridski University of Sofia EOROnu Annual Meeting, RAL, 18-21 Jan 2011
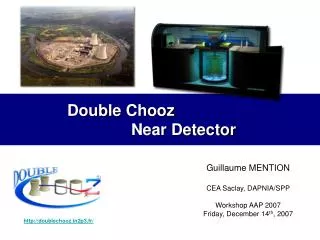
Neutrino Factory Near Detector(s) Eμ = 25 GeV ±80 MeV Straight section length = 600 m Muon angular spread 0.5 mrad 1x10²⁰ muon decays/per charge/per year Neutrino Factory Near Detector aims: • Measurement of neutrino flux with ~1% precision and extrapolation to the Far Detector; • Measurement of charm production(main background to oscillation signal); • Cross-section measurements: DIS, QEL, RES scattering; • Search for Non Standard Interactions (NSI). Can we achieve this by using the quasielastic scattering off electrons? EOROnu Annual Meeting, RAL, 18-21 Jan 2011
Measurement of the neutrino flux with a Near detector Quasi-elastic scattering off electronscan be used to measure the flux, because its absolute cross-section can be calculated theoretically with enough confidence. The two processes of interest for neutrinos from μ– decays are: for 15 GeV νμ . It is ~10-3 of σtotal(νN) EOROnu Annual Meeting, RAL, 18-21 Jan 2011
Simulation Processes included in GENIE Near detector flux simulation Quasi-elastic scattering Elastic NC scattering Baryon resonance production in CC and NC Coherent neutrino-nucleus scattering Non-resonant inelastic scattering (DIS) Quasi-elastic charm production Deep-inelastic charm production Neutrino-electron elastic scattering and inverse muon decay C. Andreopoulos et al., The GENIE Neutrino Monte Carlo Generator, arXiv:0905.2517 flux driver GENIE http://www.genie-mc.org arXiv:0905.2517 ROOT file GEANT4 ROOT file (Simple) digitization Reconstruction EOROnu Annual Meeting, RAL, 18-21 Jan 2011
Neutrino flux through the detector per 1x10²⁰μ- decays EOROnu Annual Meeting, RAL, 18-21 Jan 2011
Intrinsic and observable angles EOROnu Annual Meeting, RAL, 18-21 Jan 2011 Left – zero divergence of muon beam Right – muon beam with Gaussian spread on θ (1 mrad) Number of events differ, but there is only slight change in distribution
νµflux & IMD muons EOROnu Annual Meeting, RAL, 18-21 Jan 2011
Discriminating variables • muon scattering angleθμ; • , y – inelasticity; • muon pT2 Detector requirements: • To provide sufficient interaction rates. This requires a solid detector; • To be able to reconstruct the polar angle of the scattered muon with 0.5 mrad precision or better. This requires a low Z tracker; • To be able to measure the hadron recoil energy down to values of several MeV. This requires a precise calorimeter. EOROnu Annual Meeting, RAL, 18-21 Jan 2011
Detector design EOROnu Annual Meeting, RAL, 18-21 Jan 2011 Polystyrene (1.06 g/cm3) Approx. 2.5 t 20 modules A module: absorber & tracker station A tracker station – horizontal and vertical layers, each has 4 fiber planes shifted in respect to each other Scintillating fibers – 0.5 mm width (round or square) 24000 fibers per station Absorber is 5 cm thick, divided into 5 slabs to allow for more precise measurement of recoil energy near the event vertex We want to be able to measure deposited energy in a slab down to values of several MeV
Tracking capabilities EOROnu Annual Meeting, RAL, 18-21 Jan 2011 Rad. length X0 = 41.31 cm RMS(θplane) = 0.2 – 0.4 mrad Each module is 5.4 cm thick Ultimately, with perfect space alignment of fibers, a position resolution of 50 µm per station is achievable.
Assumptions for digitization and reconstruction EOROnu Annual Meeting, RAL, 18-21 Jan 2011 • Digitization • Fiber signal is proportional to energy deposition corrected for attenuation and smeared with a Gaussian with σ/E = 25% • Slab signal is proportional to total energy deposition, smeared with σ/E = 5% • Muon momentum can be measured with an error of 1% (not crucial for the moment) • Can determine event vertex slab with high certainty
Muon polar angle reconstruction EOROnu Annual Meeting, RAL, 18-21 Jan 2011 One configuration with 0.5 mm round fibers (top) and two configurations with 0.5 mm square fibers (bottom) Resolution ~ 0.5 mrad in all setups
Event selection EOROnu Annual Meeting, RAL, 18-21 Jan 2011 Energy deposition in the first illuminated absorber (5 cm thick) vs. reconstructed muon angle
Signal extraction (for 0.25x10²⁰μ- decays) EOROnu Annual Meeting, RAL, 18-21 Jan 2011
Latest development (not included in the IDR draft) EOROnu Annual Meeting, RAL, 18-21 Jan 2011
Background rejection EOROnu Annual Meeting, RAL, 18-21 Jan 2011 Elaborated cuts : < 1 MeV (or no) total backward energy deposition < 2.5 MeV energy deposition averaged over illuminated slabs < 4 MeV energy deposition in event vertex slab
Background subtraction exploiting anti-νμ interactions EOROnu Annual Meeting, RAL, 18-21 Jan 2011 No IMD peak in anti-νμinteractions Normalize µ+ distribution to µ- one (currently, on what appears to be a linear region) Subtract Systematic errors under investigation...
Discriminating on θμ EOROnu Annual Meeting, RAL, 18-21 Jan 2011
Discriminating on θμ2*Eμ variable EOROnu Annual Meeting, RAL, 18-21 Jan 2011
Discriminating on pt2 EOROnu Annual Meeting, RAL, 18-21 Jan 2011
μ+/μ– ratio below the treshold… EOROnu Annual Meeting, RAL, 18-21 Jan 2011
In lieu of conclusions • μ+/μ– ratio method needs further analysis and we want to go below threshold; • comparison GENIE/data for small Q2 ; • more realistic digitization (different photodetector options); • ν-e elastic scattering (can we see a signal?) – reconstruction issues. EOROnu Annual Meeting, RAL, 18-21 Jan 2011