Download
1 / 20
200 likes | 352 Vues
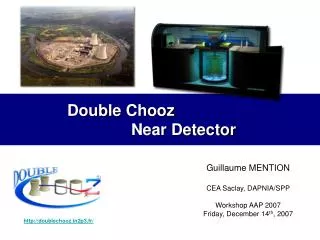
Double Chooz Near Detector. Guillaume MENTION CEA Saclay, DAPNIA/SPP Workshop AAP 2007 Friday, December 14 th , 2007. http://doublechooz.in2p3.fr/. Double Chooz detector capabilities. Double Chooz experiment The site The 2 identical detectors

E N D
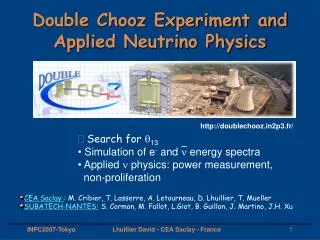
Double Chooz Near Detector Guillaume MENTION CEA Saclay, DAPNIA/SPP Workshop AAP 2007 Friday, December 14th, 2007 http://doublechooz.in2p3.fr/
Double Choozdetector capabilities • Double Chooz experiment • The site • The 2 identical detectors • The reactors: powerful anti-neutrino sources • Expected performance • Detection of reactor anti-neutrinos: e+ and neutron • Anti-neutrino spectrum measurement (Far and Near detectors) • Thermal power measurement • Burn-up detection • Conclusions
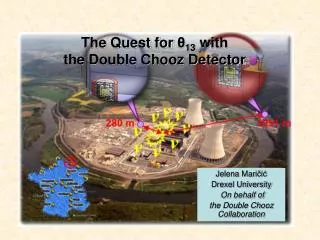
Near site: D~380 m, overburden 120 mwe Far site: D~1.05 km, overburden 300 mwe Chooz power plant map
The experiment site ν ν ν ν 1051 m 380 m ν ν ν ν
2004 2005 2006 2007 2008 2009 2010 2011 2012 Double Chooz: 2 phases Timeline Data Taking (Phase I) Site Proposal Design Construction Far Data Taking (Phase II) Cstr. Near • Double Chooz phase 1: far detector only may help to reach a higher precision on anti-ne spectrum… • Double Chooz phase 2: higher precision on anti- ne spectrum ~ 2 105 events in 3 years
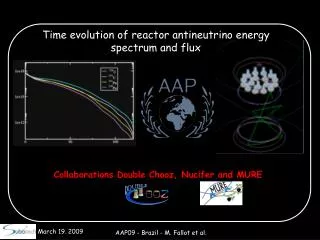
235U 239Pu Fission percentages 239Pu 238U 241Pu 235U Days Reactors are abundant antineutrino sources More than 1021 fissions/second
(1) 0,5 < Eprompt < 10 MeV (3) 1 μs < Δt < 100 μs Δt < 100 μs e+ n t (2) 6 < Edelayed< 10 MeV νe Detection technique50 years of Physics ― νe identification: using coïncidences (allows strongly reducing backgrounds) Ee+ + 1 MeV Σ ≃ 8 MeV
Calibration Glove-Box Outer Veto: plastic scintillator panels -Target:10.3 m3 liquid scintillator doped with 0.1% of Gd γ-Catcher: 22.6 m3 liquid scintillator Buffer:114 m3 mineral oil with ~400 PMTs Inner Veto:90 m3 liquid scintillator with 80 PMTs Shielding:15 cm steel Detector structure Double Chooz: 2 identical detectors 4 Liquid Volumes Far detector
fast neutrons ~ 8 MeV proton recoils Gd Correlated μ → (9Li, 8He) → β-n γ PM + rocks ~ ~ ~ Accidentals + neutron-like event ~ ~ ~ ~ ~ ~ ~ ~ ~ ~ ~ ~ ~ ~ ~ ~ ~ Backgrounds (CHOOZ data)
Far detector capabilities • Far site: phase I of Double Chooz • Anti-neutrino spectrum measurement over 1.5 years. (~ 22 000 anti-neutrinos): • Require the knowledge of the average power over 1.5 years • Require the knowledge of the average fuel composition over 1.5 years • Would allow to measure the antineutrino rate at a statistical precision of 0.7%(in case of no systematics) • But also the shape of the spectrum,with a statistical precision of 2 to 3%per energy bin (with 8 bins between1.5 and 5.5 MeV). • Systematical uncertainties reduce thispotential which is limited by the knowledgeon the detector normalization (~ 2%) andon the reactor powers (~ 2%). • Backgrounds also lead to some systematicalsubtraction error around 1% per energy bin • The measured spectrum will include the oscillationeffect. - sstat - sstat”+” ssyst # anti-ne in 1.5 years Evis in MeV
Near site location Access tunnel Map of the near site(Preliminary, still under study) • Distance to reactor cores: 456 m & 340 m 385 m (1 R. with 2Pth) • Neutrino fluxes: w/o eff. 496 anti-ne/day 2.5 105 events in 3 years (all eff. included) • Depth: 120 m.w.e. (m flux: ~ 3-4 m/m-2s-1) 456 m Chooz NPP, mass map 340 m 160 m
~ 10 000 events/month @ Double Chooz Near 1 error on thermal power measurement Huber & Schwetz hep-ph/0407026 With Double Chooz Near Average power measurement of both reactors: 5-6% over 3 weeks Thermal power measurementwith the near detector • Thermal power is measured at ~2% (?) by the nuclear power companies • Current measurement at reactor 3% but possibility of improvement • What can only neutrino do: • Independent method looking directly at the nuclear core, from outside • Cross calibration of different power plants from different sites Fig: Chooz cooling tubes = Assuming no knowledge on reactor (neither power nor fuel composition)
235U 239Pu Fission percentages 238U 241Pu Days Following up the burn-up # anti-ne in 10 days Evis in MeV Detector efficiency included. Average spectra (analytical estimations), no statistical fluctuations here Question: How far can we see two different burn-up? Try to answer with non-parametric statistical test: Kolmogorov-Smirnov
235U 239Pu Fission percentages 238U 241Pu Days Two extreme burn-up in3 weeks(identical reactors) - 9980 events - 9370 events # anti-ne in 3 weeks Preliminary Evis in MeV 2 fixed fuel compositions (in fraction of fission per isotope) 235U=0.66 239Pu=0.24 238U=0.08 241Pu=0.02 235U=0.47 239Pu=0.37 238U=0.08 241Pu=0.08 • Kolmogorov-Smirnov Test on Burn-up: Null hypothesis H0: the two “burn-up” induce identical anti-ne spectra • Shape only: PKS = 0.81 (Max Distance = 0.0093) Shapes are very close!!! • Rate and shape: PKS = 1.3 x 10⁻⁴ Rates are very different (~7% diff. on # of anti-ne)
235U 239Pu Fission percentages 238U 241Pu Days Two extreme Burn-up in10 days(identical reactors)OR 16 days with R1ONR2 OFFOR 29 days with R1 OFF R2ON - 4750 events - 4460 events # anti-ne in 10 days Preliminary Evis in MeV 2 fixed fuel compositions (in fraction of fission per isotope) 235U=0.66 239Pu=0.24 238U=0.08 241Pu=0.02 235U=0.47 239Pu=0.37 238U=0.08 241Pu=0.08 • Kolmogorov-Smirnov Test on Burn-up: Null hypothesis H0: the two “burn-up” induce identical anti-ne spectra • Shape only: PKS = 0.99 (Max Distance = 0.0093) Shapes look identical!!! • Rate and shape: PKS = 1.8 x 10⁻² Rates are different (~7% diff. on # of anti-ne)
235U 239Pu Fission percentages 238U 241Pu Days Two closer burn-up in3 weeks(identical reactors) - 9980 events - 9600 events # anti-ne in 3 weeks Preliminary Evis in MeV 2 fixed fuel compositions (in fraction of fission per isotope) 235U=0.66 239Pu=0.24 238U=0.08 241Pu=0.02 235U=0.54 239Pu=0.32 238U=0.08 241Pu=0.06 • Kolmogorov-Smirnov Test on Burn-up: Null hypothesis H0: the two “burn-up” induce identical anti-ne spectra • Shape only: PKS = 0.997 (Max Distance = 0.006) Shapes look identical!!! • Rate and shape: PKS = 4.2 10-2 Rates are different (~4 % diff. on # of anti-ne)
235U 239Pu Fission percentages 238U 241Pu Days Two still closer burn-up in3 weeks(identical reactors) - 9980 events - 9800 events # anti-ne in 3 weeks Preliminary Evis in MeV 2 fixed fuel compositions (in fraction of fission per isotope) 235U=0.66 239Pu=0.24 238U=0.08 241Pu=0.02 235U=0.61 239Pu=0.28 238U=0.08 241Pu=0.03 • Kolmogorov-Smirnov Test on Burn-up: Null hypothesis H0: the two “burn-up” induce identical anti-ne spectra • Shape only: PKS = 1.00 (Max Distance = 0.002) Looks identical!!! • Rate and shape: PKS = 0.55 Rates are too close, spectra match (~2 % diff. on # of anti-ne)
Conclusion & Outlook • Neutrinos could “take a picture” of the nuclear cores • Thermal power measurement & non proliferation applications • Thermal power measurement will rely on the absolute normalization • (but time-relative measurement of interest for burn-up, cross calibration) • - Non proliferation applications will rely on time-relative measurements • (try to detect an ‘abnormal’ burn-up) • Double Chooz Near detector will provide an unrivalled anti-ne spectrum measurement. These data will be an incredibly rich source of information in order to look for power, burn-up correlations with anti-ne spectra as a first step toward isotopic core composition. • However more precise determination of reactor power and some hints of isotopic composition might be obtained only with a closer detector to a single reactor.
Thank you for your attention! It’s time for lunch now!
Chooz Double Chooz (relative) Reactor-induced flux and 1.9 % <0.1 % Two ‘’identical’’ detectors, Low bkg Reactor power 0.7 % <0.1 % Energy per fission 0.6 % <0.1 % Detector - induced Solid angle 0.3 % <0.1 % Distance measured @ 10 cm + monitor core barycenter Target Mass 0.3 % 0.2 % Same weight sensor for both det. Density 0.3 % <0.1 % Accurate T control (near/far) H/C ratio & Gd concentration 1.2 % <0.2% Same scintillator batch + Stability Spatial effects 1.0 % <0.1 % ‘’identical’’ Target geometry & LS Live time few % 0.25 % Measured with several methods Analysis From 7 to 3 cuts 1.5 % 0.2 - 0.3 % (see next slide) Total 2.7 % < 0.6 % (Total ~0.45% without contingency ….) Systematics